Luka Mrkić
Head of BD
Insights, strategies, and real-world playbooks on AI-powered marketing.
MAY 28, 2026
How to Use AI to Track Competitor Content Strategy on LinkedIn
An AI LinkedIn content tracker is a scheduled job that collects a competitor’s posts from the previous week, asks a model to classify pillars, formats, tone, and top performer, and writes one row per competitor per week into Notion or Airtable. Phantombuster handles the collection on a managed, rate-limited posture. Claude Sonnet handles the read, turning a JSON array of posts into a structured weekly rollup.
This guide walks through the architecture, the prompts, the code, and the standards to evaluate the build. The ethics and terms-of-service framing is deliberately at the top, not buried in a footnote.
Key Takeaways
- The cheapest useful version covers three to five competitor company pages, runs once a week, and lands a one-page rollup in Slack on Monday morning.
- The build is five steps: pick competitors, configure the collector, parse posts into a strict schema, run the weekly classification, ship the digest. The hard parts are the schema and respecting LinkedIn’s terms, not the model call.
- A weak prompt returns a vibe report. A strong prompt returns strict JSON with pillar weights, format mix, top post, tone, and CTA pattern. The structured contract is what makes the cross-week comparison work.
- The metric that matters is reference rate, not row count. If nobody references a row in a meeting or content planning session that week, retune pillars or the digest format before blaming the model.
What a LinkedIn content tracker actually does
A LinkedIn content tracker watches a small set of competitor company pages and tells you, every Monday morning, what they posted in the previous seven days and what that pattern means. The output is a Notion or Airtable database where each row is one competitor for one ISO week, and each column is a signal your team cares about: post volume, content pillars, top performer, format mix, tone, CTA pattern, product vs commentary.
The old way of doing this was a quarterly screenshot exercise. Someone on the marketing team opened each competitor’s LinkedIn page, scrolled, screenshotted the best-looking posts, and dropped them in a deck. That process catches the loudest move and misses the pattern. A competitor shifts from product demos to founder commentary over six weeks and the deck never sees it because each post on its own looks normal.
The AI version watches the same company pages every week, returns the posts as structured data, asks a model to classify them into a weekly rollup, and writes one routable row per competitor. The brief reads like a status board the team can scan in two minutes.
Architecture
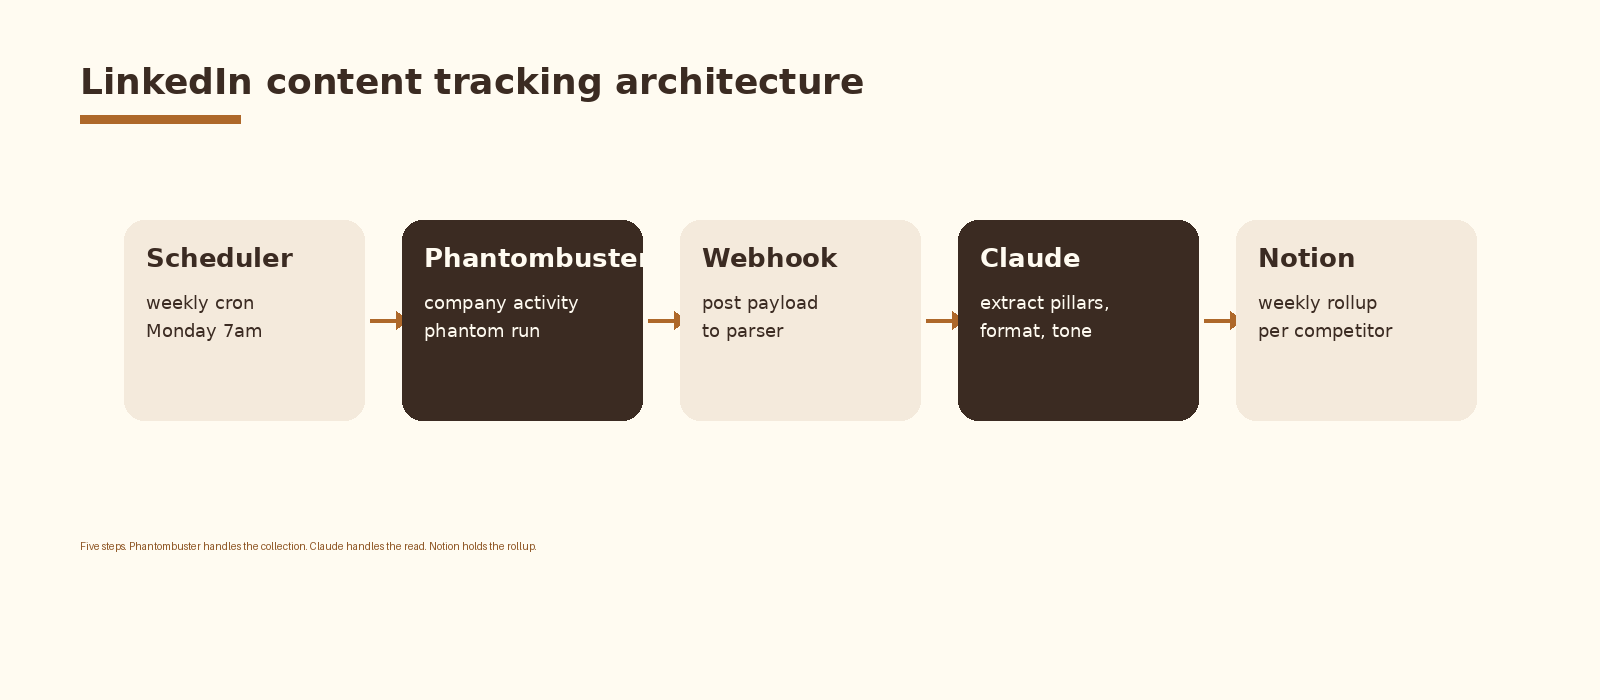
Five components. A scheduler that fires the run once a week. A collector that pulls the previous seven days of posts from a competitor’s LinkedIn company page. A parser that turns the collector payload into a normalized JSON array. A model that reads the array and classifies the week into a strict schema. A writer that lands the row in Notion or Airtable and posts the digest to Slack. Each component is replaceable; the schema between them is what holds the tracker together.
A note on LinkedIn terms of service before the build
LinkedIn’s User Agreement restricts automated collection of data from the platform. Build this tracker with that constraint at the front of your mind, not after the fact. A few rules of the road we hold ourselves to and recommend to clients:
- Use a managed collector like Phantombuster that has its own posture on rate limits and account safety. A custom scraper built on a residential proxy pool quietly becomes a second engineering project.
- Run the phantom from a dedicated LinkedIn account that is yours, not a teammate’s personal account. Account suspensions are downstream of using a personal login for automation.
- Set a conservative cadence (weekly, not daily) and stay well under documented rate limits. Competitor LinkedIn pages do not change fast enough to need daily collection.
- Only collect public company-page posts. Do not target private profiles, members of competitor employee lists, or any non-public surface.
- Use the data internally for competitive observation. Do not republish a competitor’s posts, do not redistribute the dataset, and do not feed it into anything customer-facing.
- If LinkedIn ships an official content API or partnership program that covers this use case, switch to it. Official is always preferable to unofficial.
If any of those rules conflict with how your team wants to use the output, stop the build and have the conversation before writing code. Competitive observation does not have to be aggressive to be useful.
Step 1. Pick the competitors
Start with three to five competitor company pages. The same rule from any competitor monitoring system applies: too many companies and the digest gets muted by week three. Pick the ones your sales team actually loses to, the ones your buyers actually compare you against on LinkedIn specifically, and one or two emerging entrants whose content posture you want to learn from.
Treat the company list as data, not code. A small Notion database with name, linkedin_company_url, sales_priority, and active is enough. The active flag lets you pause a competitor for a quarter without losing their history.
Step 2. Configure the Phantombuster collector
Phantombuster runs a per-company Activity phantom that returns recent posts from a company page as structured JSON. The configuration is small but the defaults matter:
- One phantom run per competitor per week. Do not batch all competitors into one run; per-company runs make rate limiting and retries cleaner.
- Limit results to posts from the previous seven days. Phantombuster lets you cap by count; pair it with a date filter in the parser.
- Send the result to a webhook your backend owns. The phantom should not write directly to Notion; the webhook lets you validate, deduplicate, and retry.
- Run with the dedicated LinkedIn account configured in Phantombuster’s identity layer, not a personal session cookie.
The webhook receives a JSON payload per phantom run. Normalize each post to a small shape your downstream parser and model expect: post_url, posted_at, author_name, author_type (company or employee), text, format (text, image, video, carousel, document, article), reactions, comments, reposts.
# parse_phantom.py
from datetime import datetime, timedelta, timezone

FORMAT_MAP = {
    "linkedinPost": "text",
    "linkedinImagePost": "image",
    "linkedinVideoPost": "video",
    "linkedinCarouselPost": "carousel",
    "linkedinDocumentPost": "document",
    "linkedinArticle": "article",
}

def normalize(payload: list[dict], iso_monday: str) -> list[dict]:
    monday = datetime.fromisoformat(iso_monday).replace(tzinfo=timezone.utc)
    window_start = monday - timedelta(days=7)
    out = []
    for p in payload:
        posted_at = datetime.fromisoformat(p["postDate"].replace("Z", "+00:00"))
        if not (window_start <= posted_at < monday):
            continue
        out.append({
            "post_url": p["postUrl"],
            "posted_at": posted_at.isoformat(),
            "author_name": p.get("authorName", ""),
            "author_type": "company" if p.get("isCompanyPost") else "employee",
            "text": (p.get("postContent") or "")[:2000],
            "format": FORMAT_MAP.get(p.get("postType"), "text"),
            "reactions": int(p.get("likeCount", 0)),
            "comments": int(p.get("commentCount", 0)),
            "reposts": int(p.get("repostCount", 0)),
        })
    return out
Step 3. Classify the week with Claude
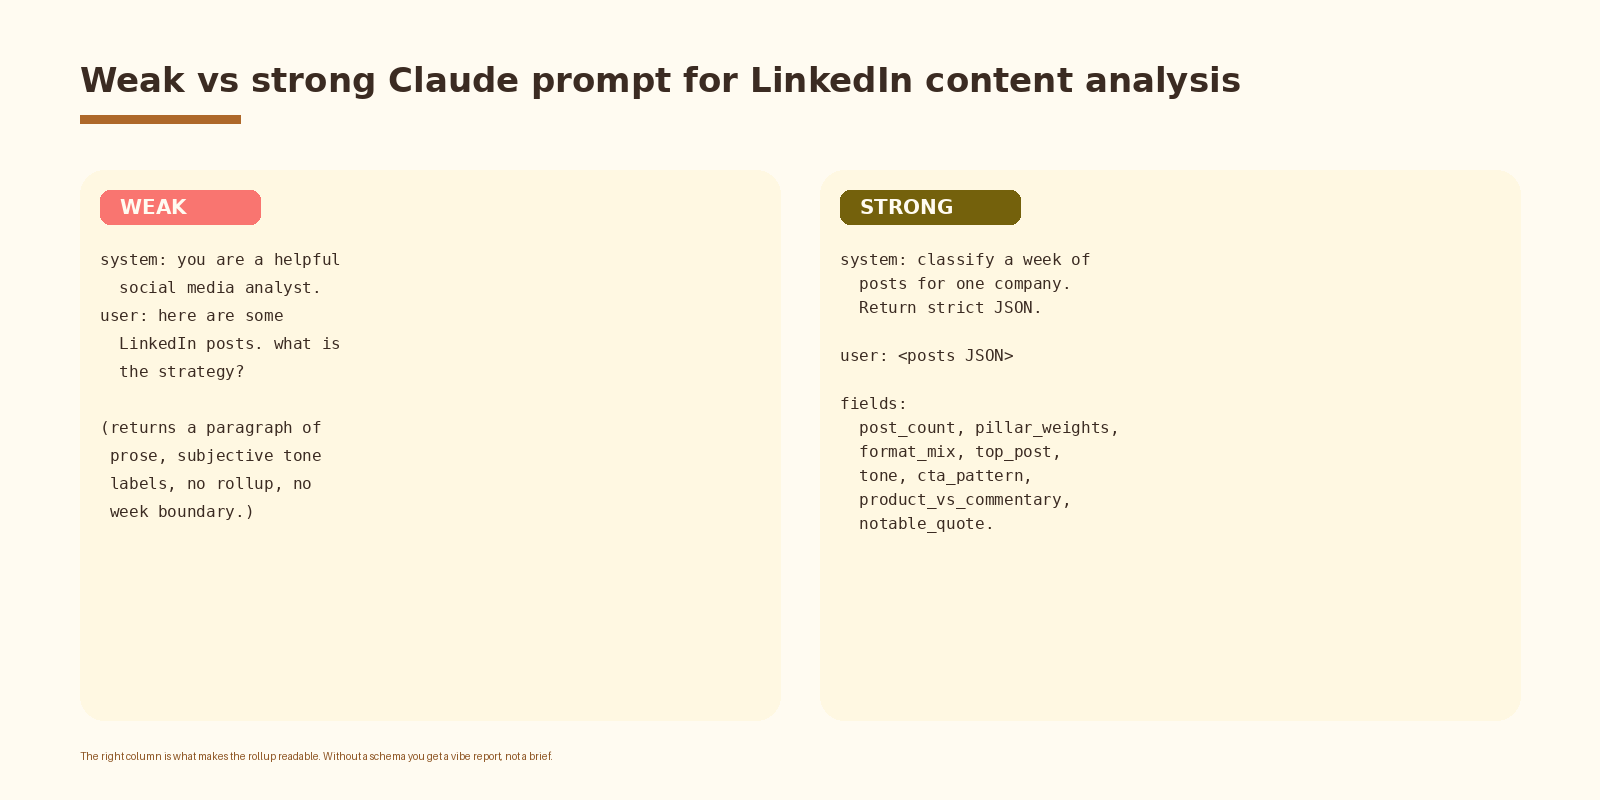
This is where the tracker earns its keep. The collector gives you a JSON array of fifteen posts. The model’s job is to turn that array into a single weekly rollup that the team can read in two minutes.
# classify_week.py
import json, os
import anthropic

client = anthropic.Anthropic(api_key=os.environ["ANTHROPIC_API_KEY"])

SYSTEM = """You analyze one company's public LinkedIn posts for one ISO week.

Return STRICT JSON with these keys:
- post_count: integer
- pillar_weights: object mapping pillar name to fraction 0..1 (max 4 pillars)
- format_mix: object mapping format name to count
- top_post: { url, reactions, one_line_angle }
- tone: one of [founder_led, brand_led, employee_advocacy, mixed]
- cta_pattern: short string describing the dominant CTA pattern, or null
- product_vs_commentary: object with two fractions that sum to 1.0
- notable_quote: a single short verbatim quote from the strongest post, or null
- week_summary: one sentence, max 25 words

Use the post text and metrics provided. Do not invent posts. If a field has
no signal, set it to null or an empty object."""

def classify(company: str, iso_week: str, posts: list[dict]) -> dict:
    msg = client.messages.create(
        model="claude-sonnet-4-5",
        max_tokens=900,
        system=SYSTEM,
        messages=[{
            "role": "user",
            "content": (
                f"Company: {company}. Week: {iso_week}. "
                f"Posts JSON:\n{json.dumps(posts)[:18000]}"
            ),
        }],
    )
    text = msg.content[0].text
    return json.loads(text[text.find('{'):text.rfind('}')+1])
Two design choices in that prompt matter. Pillar weights as fractions force the model to commit to a real distribution across at most a few themes. Capping at four pillars stops the model from inventing categories like every-post-is-its-own-pillar, which makes the cross-week comparison useless.
If you want this set up cleanly inside your stack with logging, retries, and a feedback loop into a CRM, that is the kind of work we ship at Espressio.
Step 4. Write the row and ship the digest
Once the classifier returns the weekly rollup, the rest is a single Notion or Airtable write per competitor. Map each field to a property: post_count and the format_mix counts as numbers, pillar_weights as a small rich text block, top_post as a URL plus its angle, tone as a select, the week_summary as the headline. Push the source post_urls into a relation or URL list so the team can click through when something looks interesting.
On Monday morning, query the database for rows where Week equals last Monday and assemble a Slack digest. One section per competitor. Headline is the week_summary. Bullet list is pillar_weights and format_mix. Footer link is the top_post URL. The whole digest fits on one screen, which is the only length the team will reliably read.
Signals worth tracking
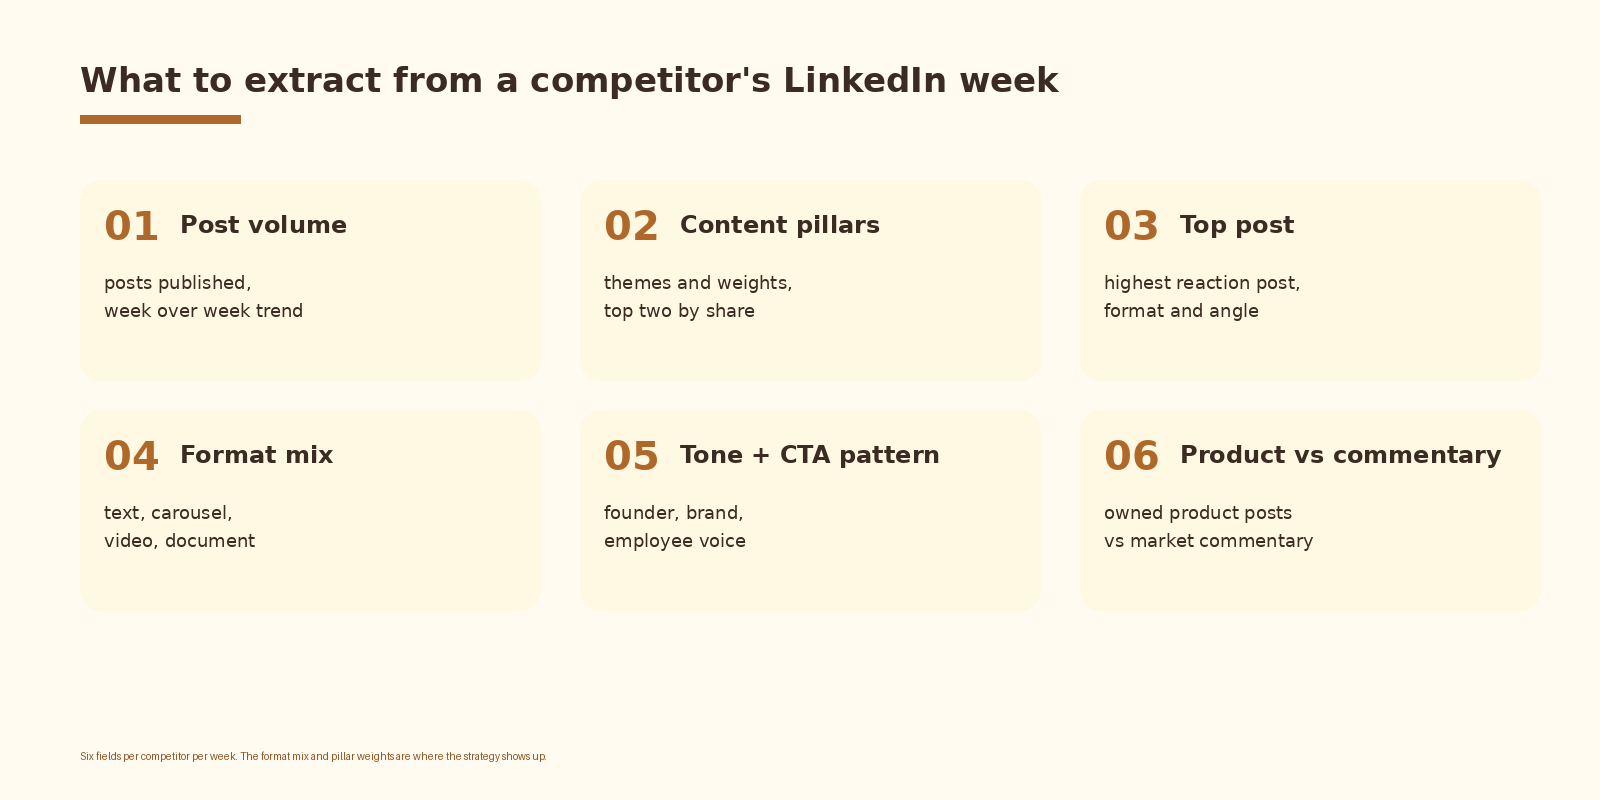
Six fields in the default schema. Post volume and content pillars are the two that almost always pay back the build. Format mix is the leading indicator that a competitor is investing in video or document content before the strategy gets named publicly. Tone (founder-led vs brand-led vs employee advocacy) is the cultural read; it tells you what kind of LinkedIn presence your competitor is building. Top post is the one anyone in the team can scan in five seconds and learn something from. CTA pattern and product-vs-commentary are useful once the first four are reliable.
Common mistakes
- Watching too many companies. Ten company pages becomes a wall of text. Three to five is the right starting number.
- Treating LinkedIn ToS as an after-thought. Set the rules before you build, not after. Weekly cadence, dedicated account, public company pages only.
- Letting the model freelance pillars. Without a cap on pillar count and a fraction-based weighting, every week looks different and cross-week comparison breaks.
- Counting reactions only. Reactions are noisy. Treat top_post as a model-picked angle, not a sort by reaction count, and the digest gets more interesting fast.
- Skipping the date window in the parser. Phantombuster returns recent posts but not always strictly the last seven days. Filter in the parser so the rollup is bound to a real ISO week.
How to know it is working
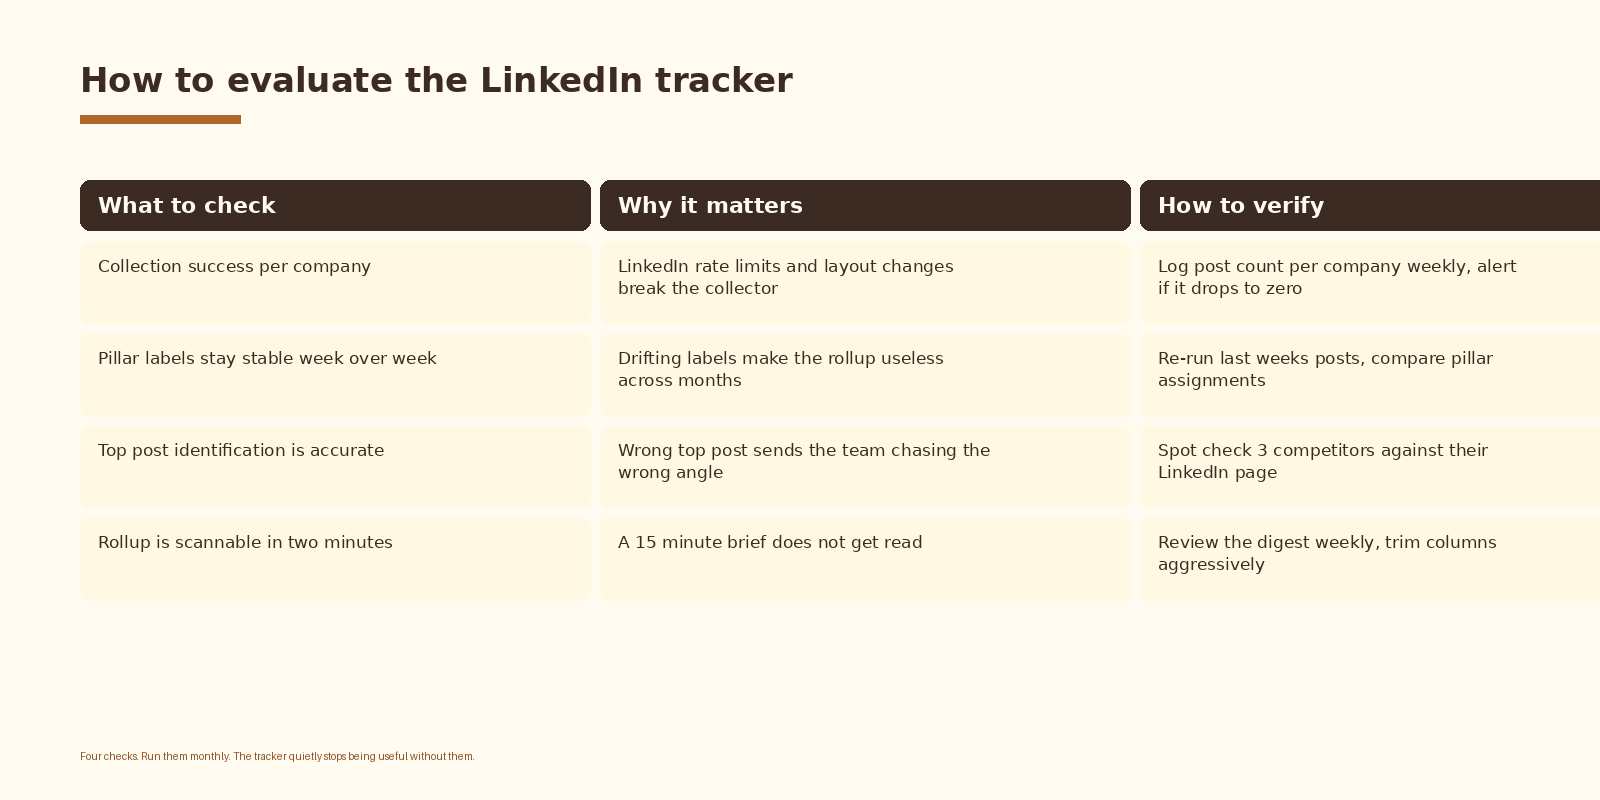
The metric that matters is reference rate, not row count. Track how many times someone on the team referenced a specific row in a meeting, a strategy doc, or a content planning session that week. If the answer trends to zero, the problem is almost always the digest format or the pillar labeling, not Phantombuster.
FAQ
Is this allowed under LinkedIn’s terms?
LinkedIn’s User Agreement restricts automated data collection from the platform. The build above stays as conservative as we know how to make it: managed collector, dedicated account, weekly cadence, public company-page posts only, internal use only, ready to switch to an official API or partnership program as soon as one covers the use case. If your legal posture requires a fully official data source, do not run this pattern; use a media-monitoring vendor with a LinkedIn partnership instead.
Why Phantombuster and not a custom scraper?
A managed collector exists to absorb the maintenance burden of rate limits, layout changes, and account safety. A custom scraper is a project that quietly demands more attention than the rest of the tracker combined. The whole point of this build is to spend the analytical work on the content read, not the collection.
Can the same tracker watch founders and employee posts, not just company pages?
Technically yes; we do not recommend it. Employee and founder posts are personal accounts, and tracking individuals from competitor teams pulls the system into a different ethical and legal posture than watching a public company page. Stay on company pages for this build.
Which model should I use?
Claude Sonnet handles this workload well. Haiku is faster and cheaper but gives up consistency on the pillar-weighting schema. GPT-4-class models with strict JSON mode also work; the prompt and the schema do most of the work, not the model brand.
How often should the tracker run?
Weekly is the default. Daily is unnecessary because LinkedIn company pages do not change that often, and the noise floor goes up. Monthly is too slow because content pivots aging into the next quarter is exactly what you are trying to catch early.
What to do next
- Pick three competitor company pages and write the sales-priority and owner before any code. Confirm the use case is comfortable under your reading of LinkedIn’s terms.
- Set up a dedicated LinkedIn account in Phantombuster. Configure one company-activity phantom per competitor on a weekly schedule.
- Stand up the webhook and the parser. Run one phantom end to end and confirm you get a clean normalized array of last week’s posts.
- Wire the Claude classifier against one competitor. Eyeball the rollup, tune the system prompt against the real posts, lock the schema.
- Wire the Notion or Airtable writer and the Monday Slack digest. Turn it on for the team.
- Review the reference rate after thirty days. Retune pillars or the digest format before adding more competitors.
If you want automation like this set up cleanly inside your competitive intelligence stack, let’s talk.
Related Espressio guides