Luka Mrkić
Head of BD
Insights, strategies, and real-world playbooks on AI-powered marketing.
MAY 29, 2026
How to Monitor Competitor Ad Spend with AI Tools in 2026
TL;DR
- Pull creatives daily from Meta, Google, LinkedIn, and TikTok ad libraries. Layer SimilarWeb or SEMrush plus Adbeat or Pathmatics on top for paid intel.
- Normalize every ad into one schema (advertiser, platform, creative_id, first_seen, last_seen, est_spend_range, creative_text, cta, landing_url).
- Run Claude or GPT over the weekly delta to cluster by angle, flag new creatives, and produce a Slack and Notion brief.
- Treat spend numbers as estimates outside EU political ads. Track direction and creative volume, not exact dollars.
- Keep a human reviewer between the AI brief and any internal alert. Always.
If you are evaluating who should build this for your team, this guide gives you both the technical blueprint and the standards to evaluate the work.
The short answer
Wire daily creative pulls from official ad libraries into a normalized table, run a weekly Claude pass to cluster and diff, and ship the output to Slack and Notion. That is the entire system. The rest of this guide is how each layer actually works in 2026, what data you can and cannot trust, and what good looks like.
The six ad-signal sources to wire in
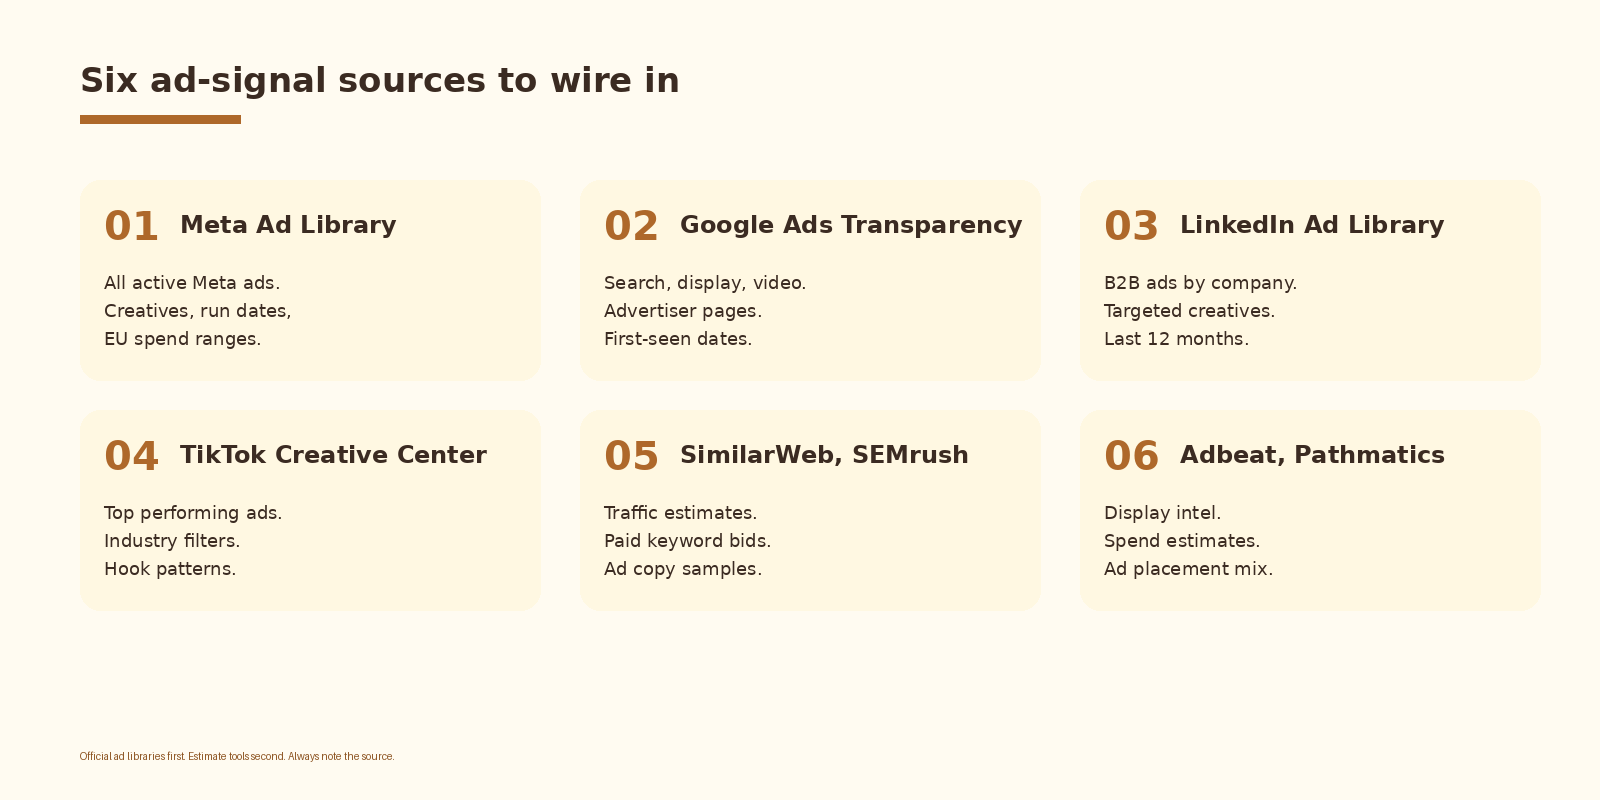
Six layers cover most of what you need. The first four are official platform-owned ad libraries. The last two are paid intel tools that estimate spend from panel data and ad-server pings.
Meta Ad Library
Every active Meta ad is exposed: creative, run dates, advertiser page, and for EU political and social-issue ads, a spend range. You can hit it manually or with an API access token. Estimated spend for normal commercial ads is not published. Treat creative count and run duration as your real signal.
Google Ads Transparency Center
Search, display, and video ads are surfaced by advertiser page. You see creatives, formats, and first-seen dates. Spend is shown for political ads only. For commercial monitoring, use the creative volume per format as the signal.
LinkedIn Ad Library
B2B ads by company, last 12 months. Useful for sales-led and account-based competitors. Pull both the creative and the targeting tags when visible.
TikTok Creative Center
Top performing ads by industry, region, and date. Strong for hook patterns and creative format research. Pair with rough impressions buckets to spot which angles are scaling.
SimilarWeb and SEMrush
Traffic estimates, paid keyword bids, and ad copy samples. These tools rely on panel data. Use as directional, not precise. Cross-check anything important with the official ad libraries.
Adbeat and Pathmatics
Display intel: spend estimates, placements, and ad-server data. Costs more than the others. Worth it once you have at least 10 advertisers you watch every week.
The data pipeline architecture
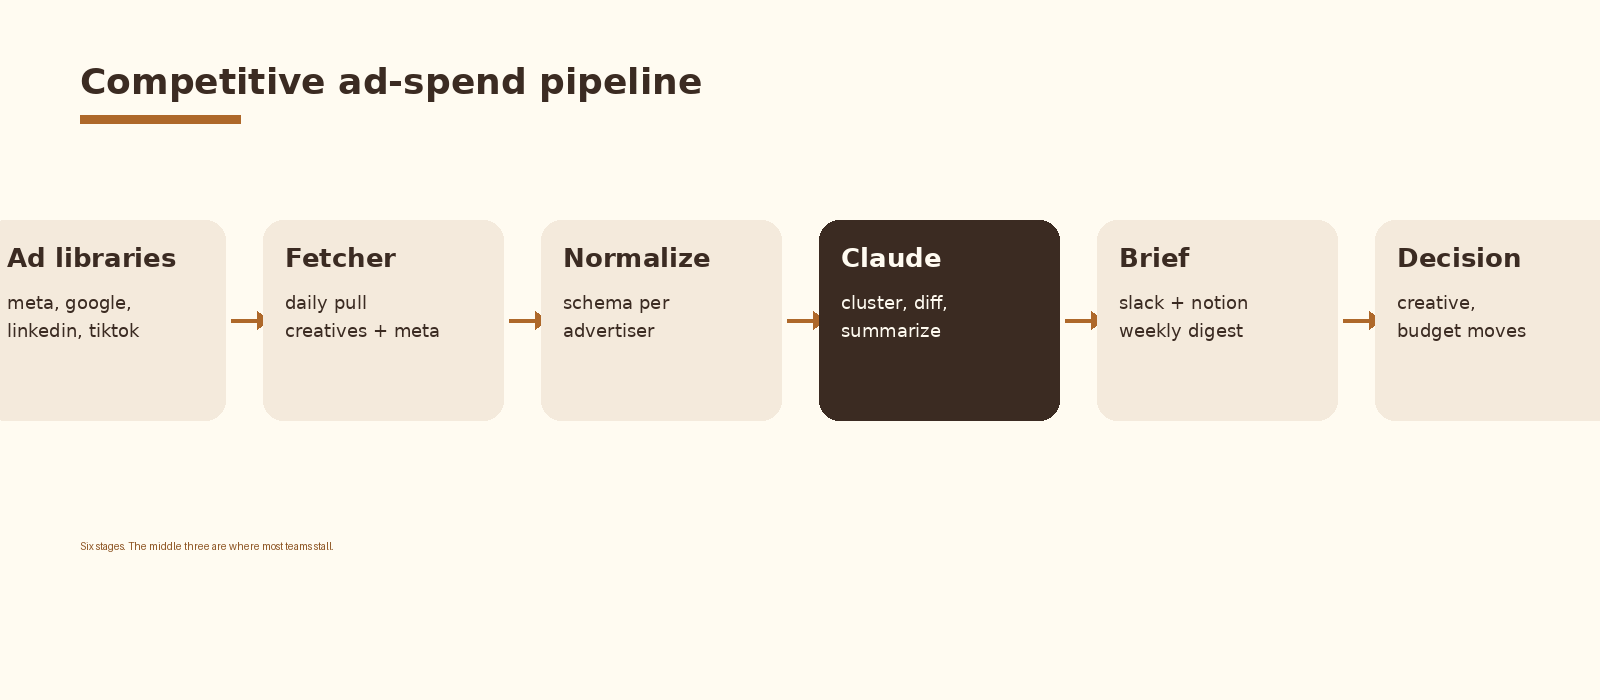
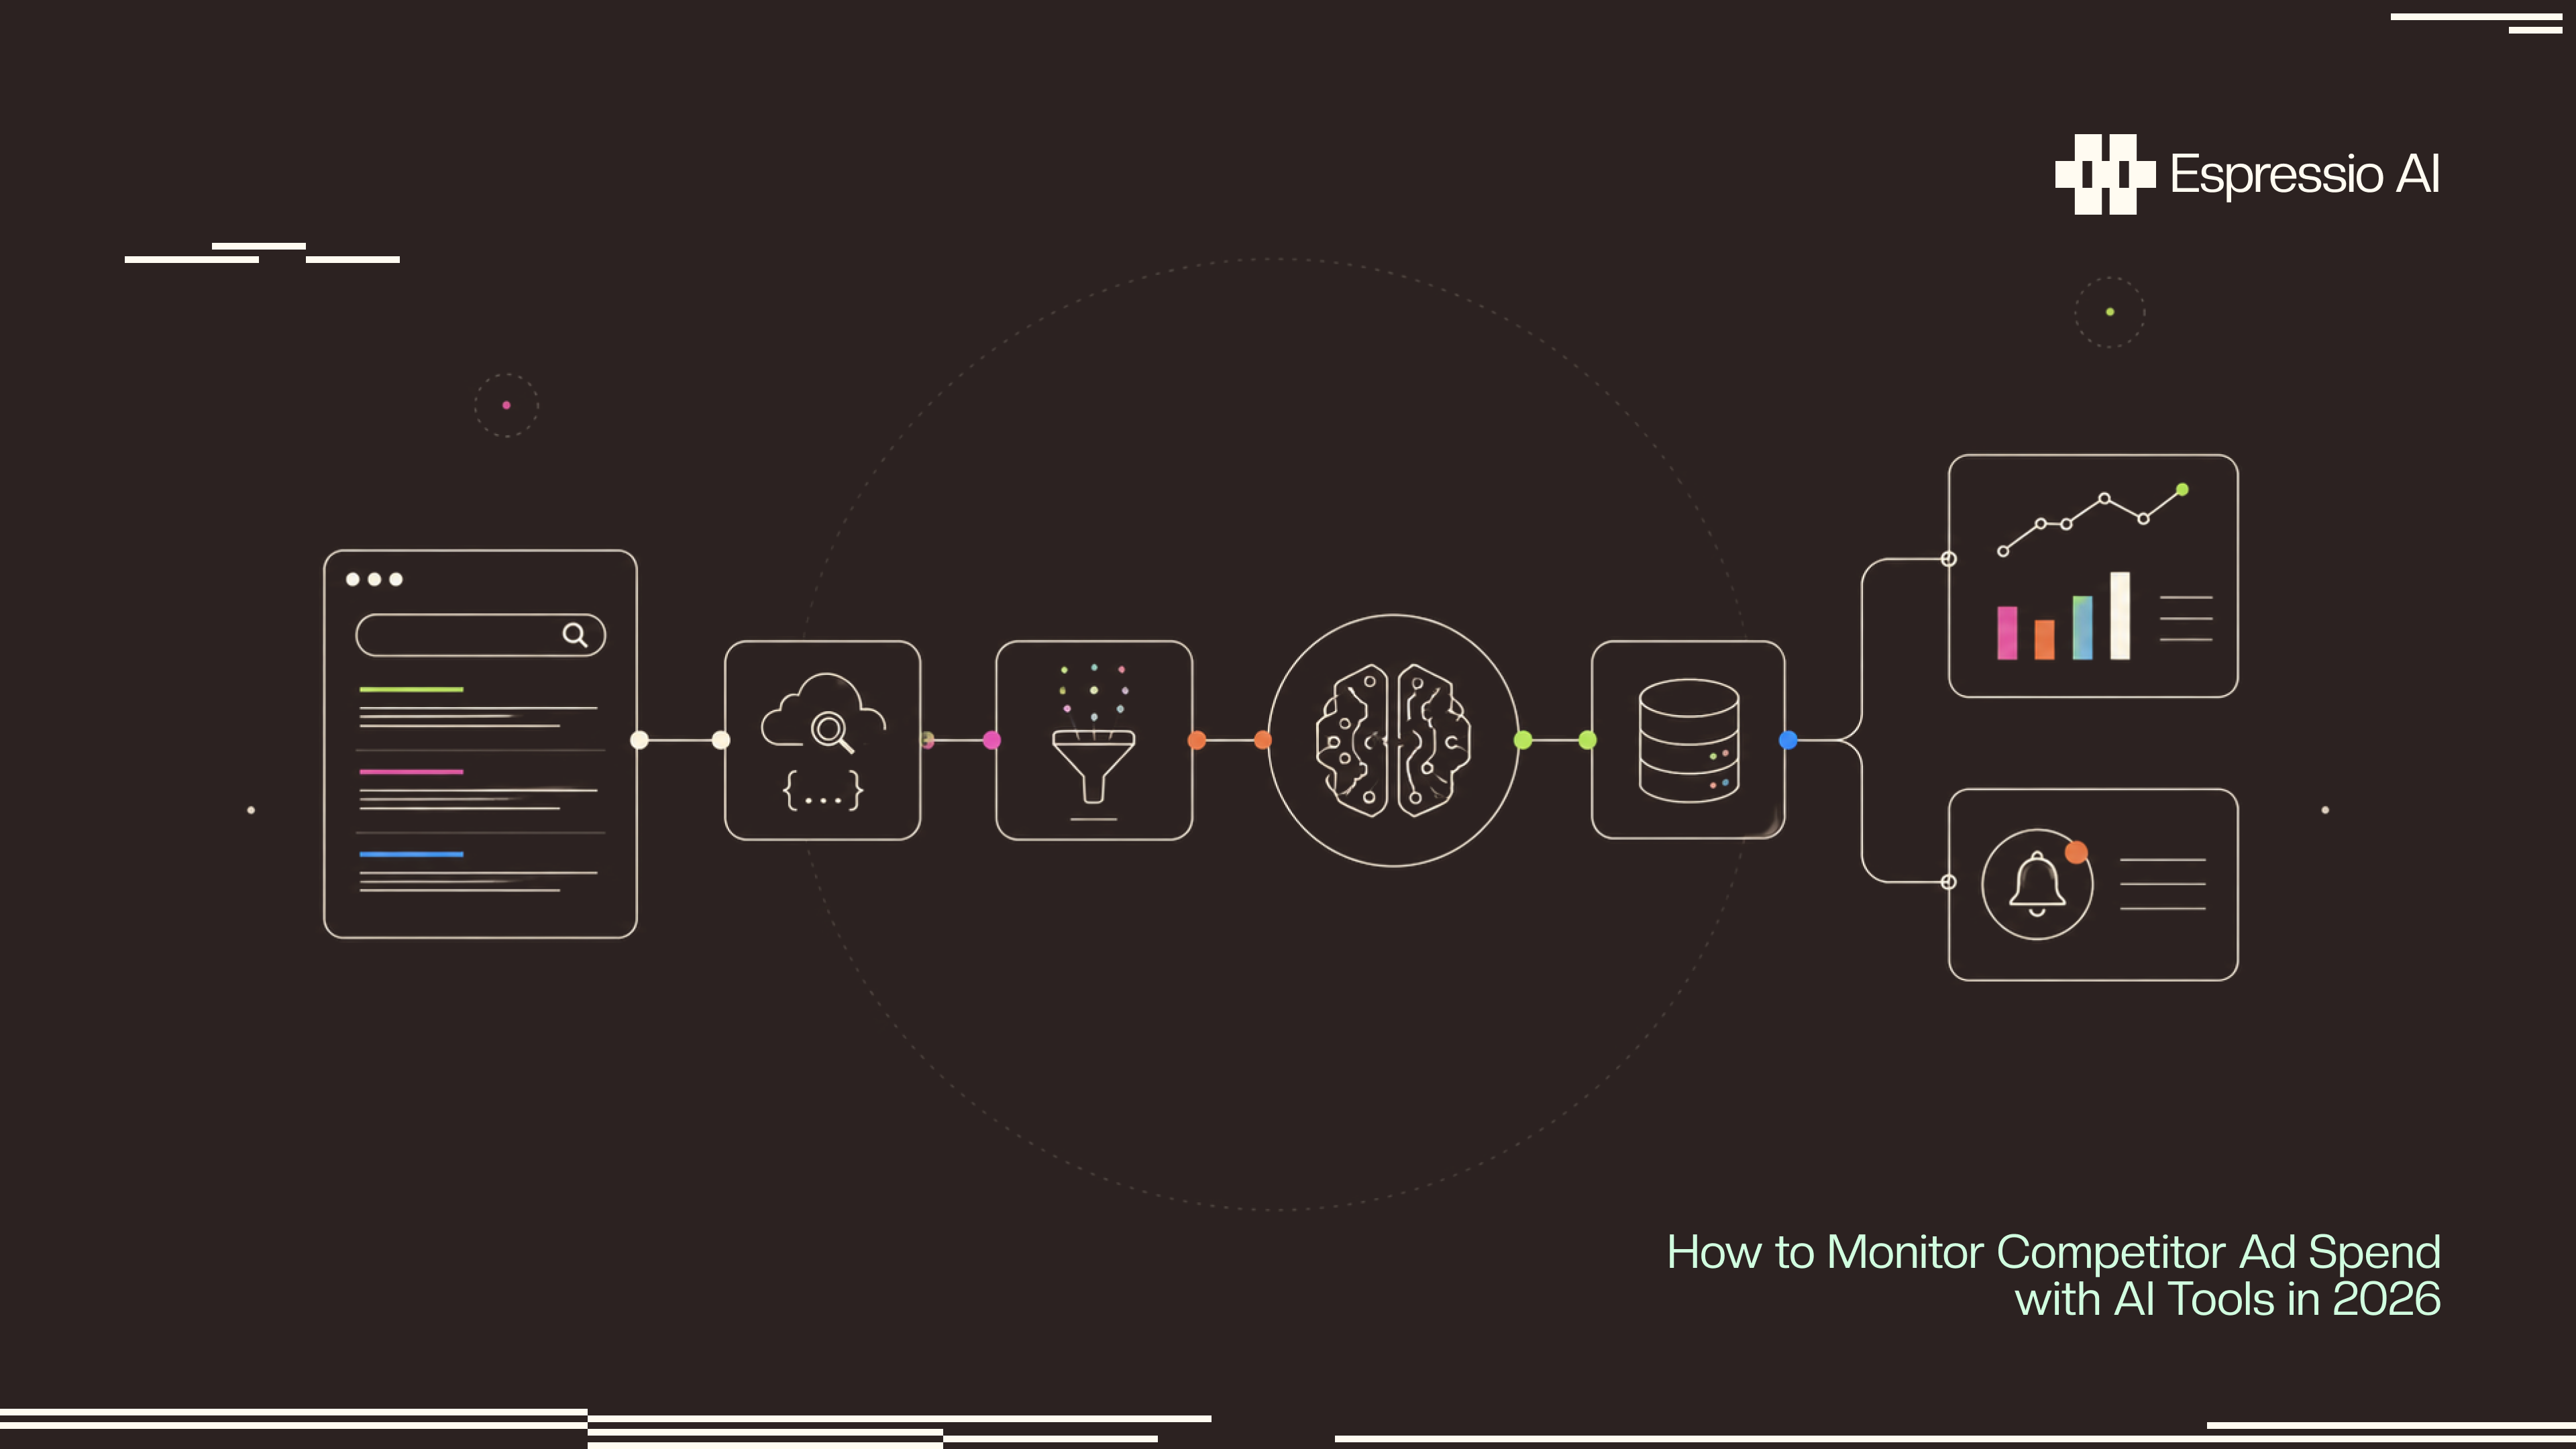
The pipeline has six stages. A fetcher runs daily per source and writes raw creatives plus metadata to object storage. A normalizer maps each platform into one shared schema. Claude then clusters by message and angle, computes a week-over-week diff, and writes a summary. Slack and Notion receive the brief. A reviewer can override before anything goes wide.
The normalized schema looks like this: advertiser, platform, creative_id, first_seen, last_seen, est_spend_range, creative_text, cta, landing_url. Every fetcher writes into that shape. Anything platform-specific (targeting tags, EU spend ranges, format) goes in a sidecar JSON column so you do not lose it.
A concrete Claude prompt for the weekly brief
Run this against the weekly delta JSON. The output is structured so Notion and Slack can render it without a second LLM pass.
System: You are a competitive ad analyst. You read normalized ad data and produce concise weekly briefs. You never state exact spend numbers; you describe qualitative direction. Output valid JSON only.

User: Here is the week-over-week delta for {advertiser} across {platforms}. For each advertiser, return:
  {
    "advertiser": "...",
    "new_angles_spotted": [ "...", "..." ],
    "angles_paused": [ "..." ],
    "suspected_budget_direction": "increasing | flat | decreasing | unclear",
    "evidence": "one short sentence citing creative counts and dates",
    "watch_next_week": [ "..." ]
  }
Be specific about angles. Do not invent numbers.
Hitting the Anthropic API with the daily payload
import os, json, anthropic

client = anthropic.Anthropic(api_key=os.environ["ANTHROPIC_API_KEY"])

with open("delta-2026-W22.json") as f:
    delta = json.load(f)

resp = client.messages.create(
    model="claude-sonnet-4-5",
    max_tokens=4000,
    system=SYSTEM_PROMPT,
    messages=[{"role": "user", "content": json.dumps(delta)}],
)

brief = json.loads(resp.content[0].text)
with open("brief-2026-W22.json", "w") as f:
    json.dump(brief, f, indent=2)
If you want this set up cleanly inside your stack with logging, retries, and a feedback loop into a CRM, that is the kind of work we ship at Espressio.
Weak vs strong: what the upgrade actually changes
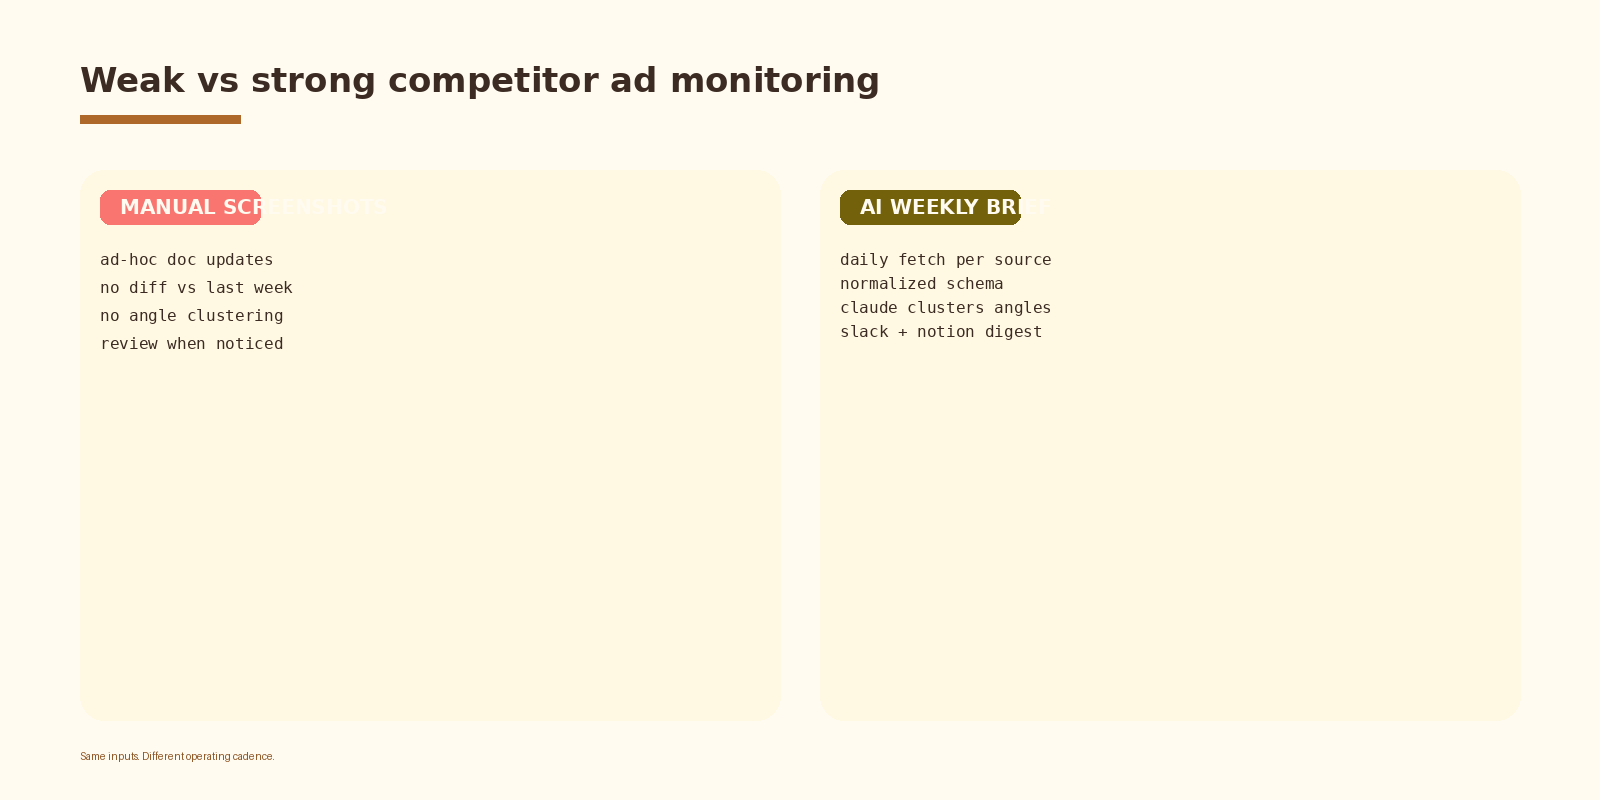
Manual screenshots in a Google Doc give you a snapshot. They tell you what a competitor is running today. They do not tell you what changed this week, which angles cluster together, or which advertisers are accelerating. A weekly AI brief does. Same raw inputs, different operating cadence.
Evaluator scorecard
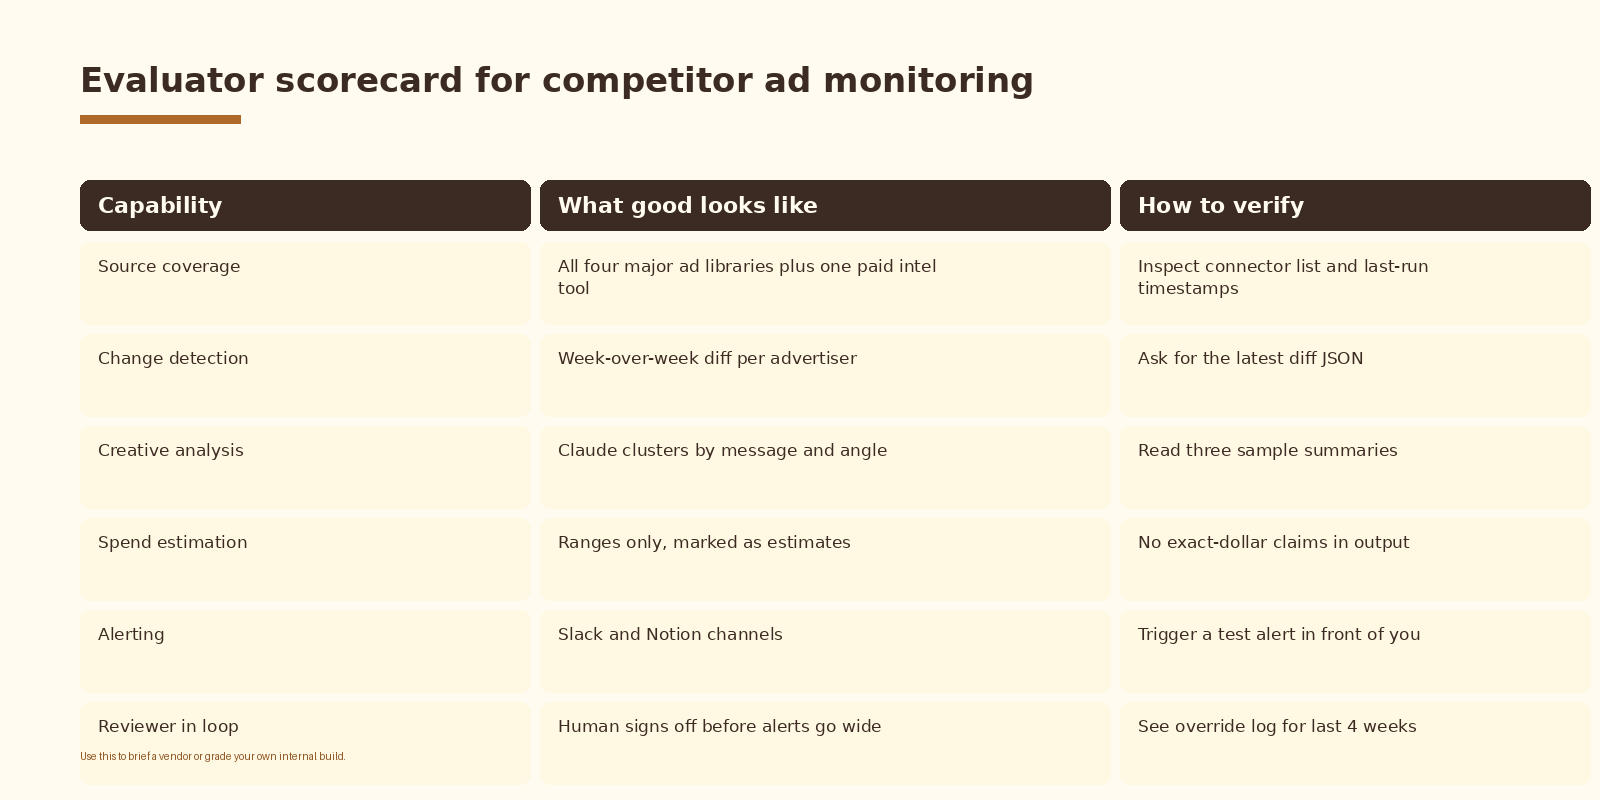
Use this to brief a vendor or grade your own internal build. Each row is something you can verify in under five minutes by asking for an artifact (a connector list, a diff JSON, a sample summary, an override log).
Legal and ethical guardrails
Pull from official ad libraries first. They exist specifically for this use case. Respect each platform’s terms of service. Rate limit your fetchers so you do not look like a scraper. Attribute estimated numbers to the tool that produced them. Do not scrape behind login walls.
Common mistakes
- Treating estimated spend numbers as exact. Outside EU political ads, spend is almost always an estimate. Phrase it that way.
- Scraping behind login walls or ignoring rate limits. Use official APIs and respect terms.
- Skipping the human review gate. AI summaries are useful, not authoritative. A reviewer signs off before alerts go to channels.
- Alerting on noise. A single new creative is not a budget shift. Set thresholds on creative volume change and run duration before firing alerts.
- Forgetting the schema. Without one shared shape across sources, the Claude pass cannot diff cleanly.
How to know it is working
These are the metrics worth tracking. Watch how they move as you tighten the pipeline. Do not set targets.
- Share of voice by creative count week over week (per advertiser, per platform).
- New-angle detection rate: how many genuinely new messaging angles the brief surfaces each week.
- Time from competitor launch to internal alert (in days).
- Reviewer override rate on AI summaries. Track whether this trends down over a few weeks of prompt tuning.
- Source coverage: percentage of watched advertisers with at least one source pulled in the last 24 hours.
FAQ
Is competitor ad spend data accurate?
For EU political and social-issue ads, yes. Spend ranges are published by Meta and Google. For everything else, you are reading estimates from panel-based tools. Treat the direction as the signal. Treat the absolute number as a vibe.
Can I see exact spend numbers?
Only for EU political ads in Meta and Google’s transparency centers. Commercial spend is not disclosed. SimilarWeb, Adbeat, and Pathmatics produce estimates with their own methodology. Cite the source whenever you quote a number.
Is scraping ad libraries legal?
Official ad libraries are public. Meta, Google, LinkedIn, and TikTok each publish them under their own terms. Use the official APIs where they exist, rate limit your fetchers, and do not bypass authentication walls. Legal review is your call (and your lawyer’s).
Which AI model is best for this?
Anything with a long context window and reliable JSON output. Claude Sonnet 4.5 and GPT-4o both work well for the weekly summarization pass. The prompt matters more than the model.
How often should the brief run?
Daily for fetchers. Weekly for the Claude summarization and the human-reviewed Slack and Notion brief. Anything more frequent is noise; anything less and you miss creative launches.
What to do next
- Pick your top 5 competitors. Write the list down somewhere durable.
- Stand up fetchers for Meta, Google, LinkedIn, and TikTok ad libraries. Schedule them daily.
- Define the normalized schema and write the per-source mappers.
- Write the Claude weekly-summary prompt. Test it on three weeks of historical data first.
- Schedule the first weekly brief into Slack and Notion. Put a human reviewer between the AI and the channels.
If you want competitive intelligence set up cleanly inside your growth stack, let’s talk.
Related Espressio guides