
Kimmo Hakonen
Chief Innovation Officer
Insights, strategies, and real-world playbooks on AI-powered marketing.
APR 29, 2026
How to Integrate Claude with Google Analytics 4
GA4 is installed on 14.7 million websites. Most teams never get past the default reports. The interface is the bottleneck: GA4 requires six or more steps for tasks that took two clicks in Universal Analytics, and 72% of its users find it complex and unintuitive (Digital Applied, April 2026). Only 28% of teams use Exploration reports. Only 34% touch predictive metrics.
Connecting Claude to GA4 bypasses the navigation entirely. You ask a question in plain English and get a structured answer in seconds: weekly channel breakdowns, campaign comparisons, anomaly alerts, exec summaries. This guide covers four ways to make that connection, from a no-setup CSV export that works today to a real-time MCP server, plus the prompt templates that produce reports worth sharing.
If you’re already automating your marketing workflow with Claude, GA4 is the most valuable data source to add next.
Key Takeaways
- 72% of in-house marketers have more GA4 data than they can act on (Funnel/Ravn Research, December 2025). Claude converts live queries or raw exports into structured reports in under a minute.
- Four integration paths exist: Google’s official GA4 MCP server (free, real-time), no-code connectors like Windsor.ai (paid, 10-min setup), CSV export (free, no setup), and custom API scripting (enterprise).
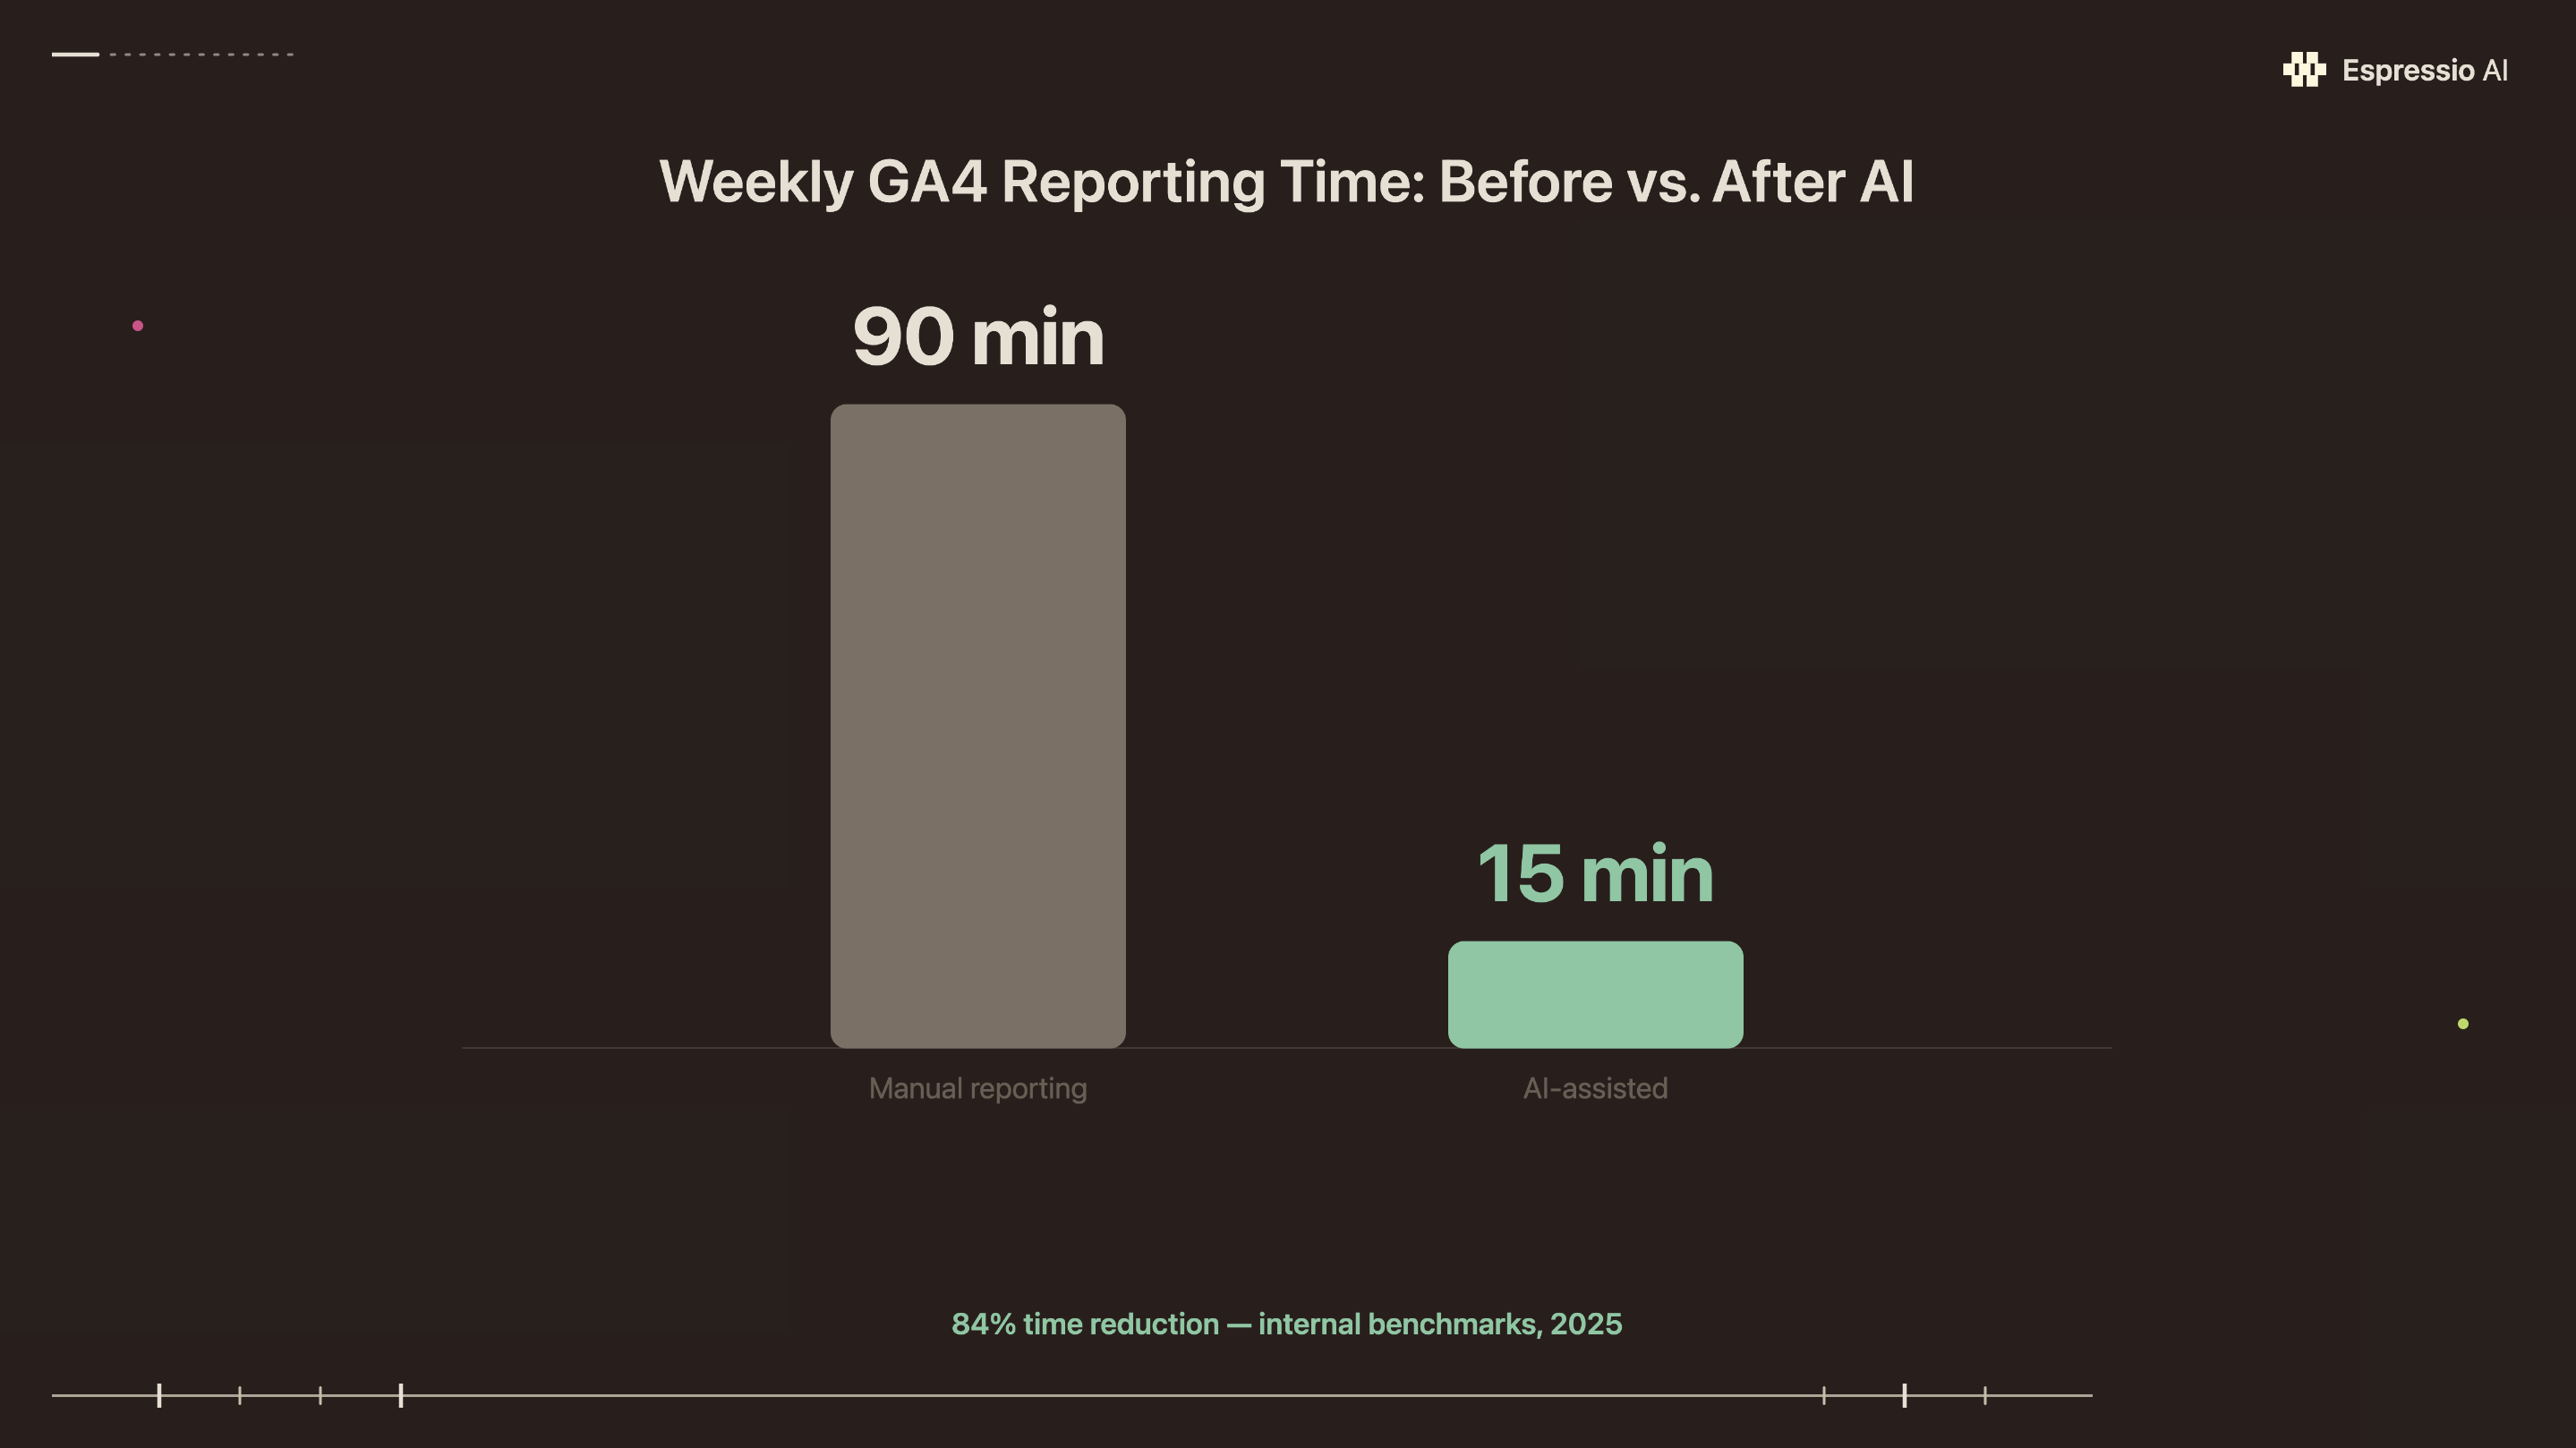
- Claude cuts median task time by 84% (Anthropic, 2025); a typical 90-minute weekly GA4 report becomes roughly a 15-minute conversation.
Why isn’t GA4 enough for marketing teams in 2026?
72% of GA4 users report the interface is complex and unintuitive, and only 28% use Exploration reports despite them being one of the platform’s most flexible analysis tools (Digital Applied, April 2026). For marketing teams without a dedicated analyst, GA4 is a traffic counter rather than a decision engine.
Most GA4 properties use only a fraction of what’s available:
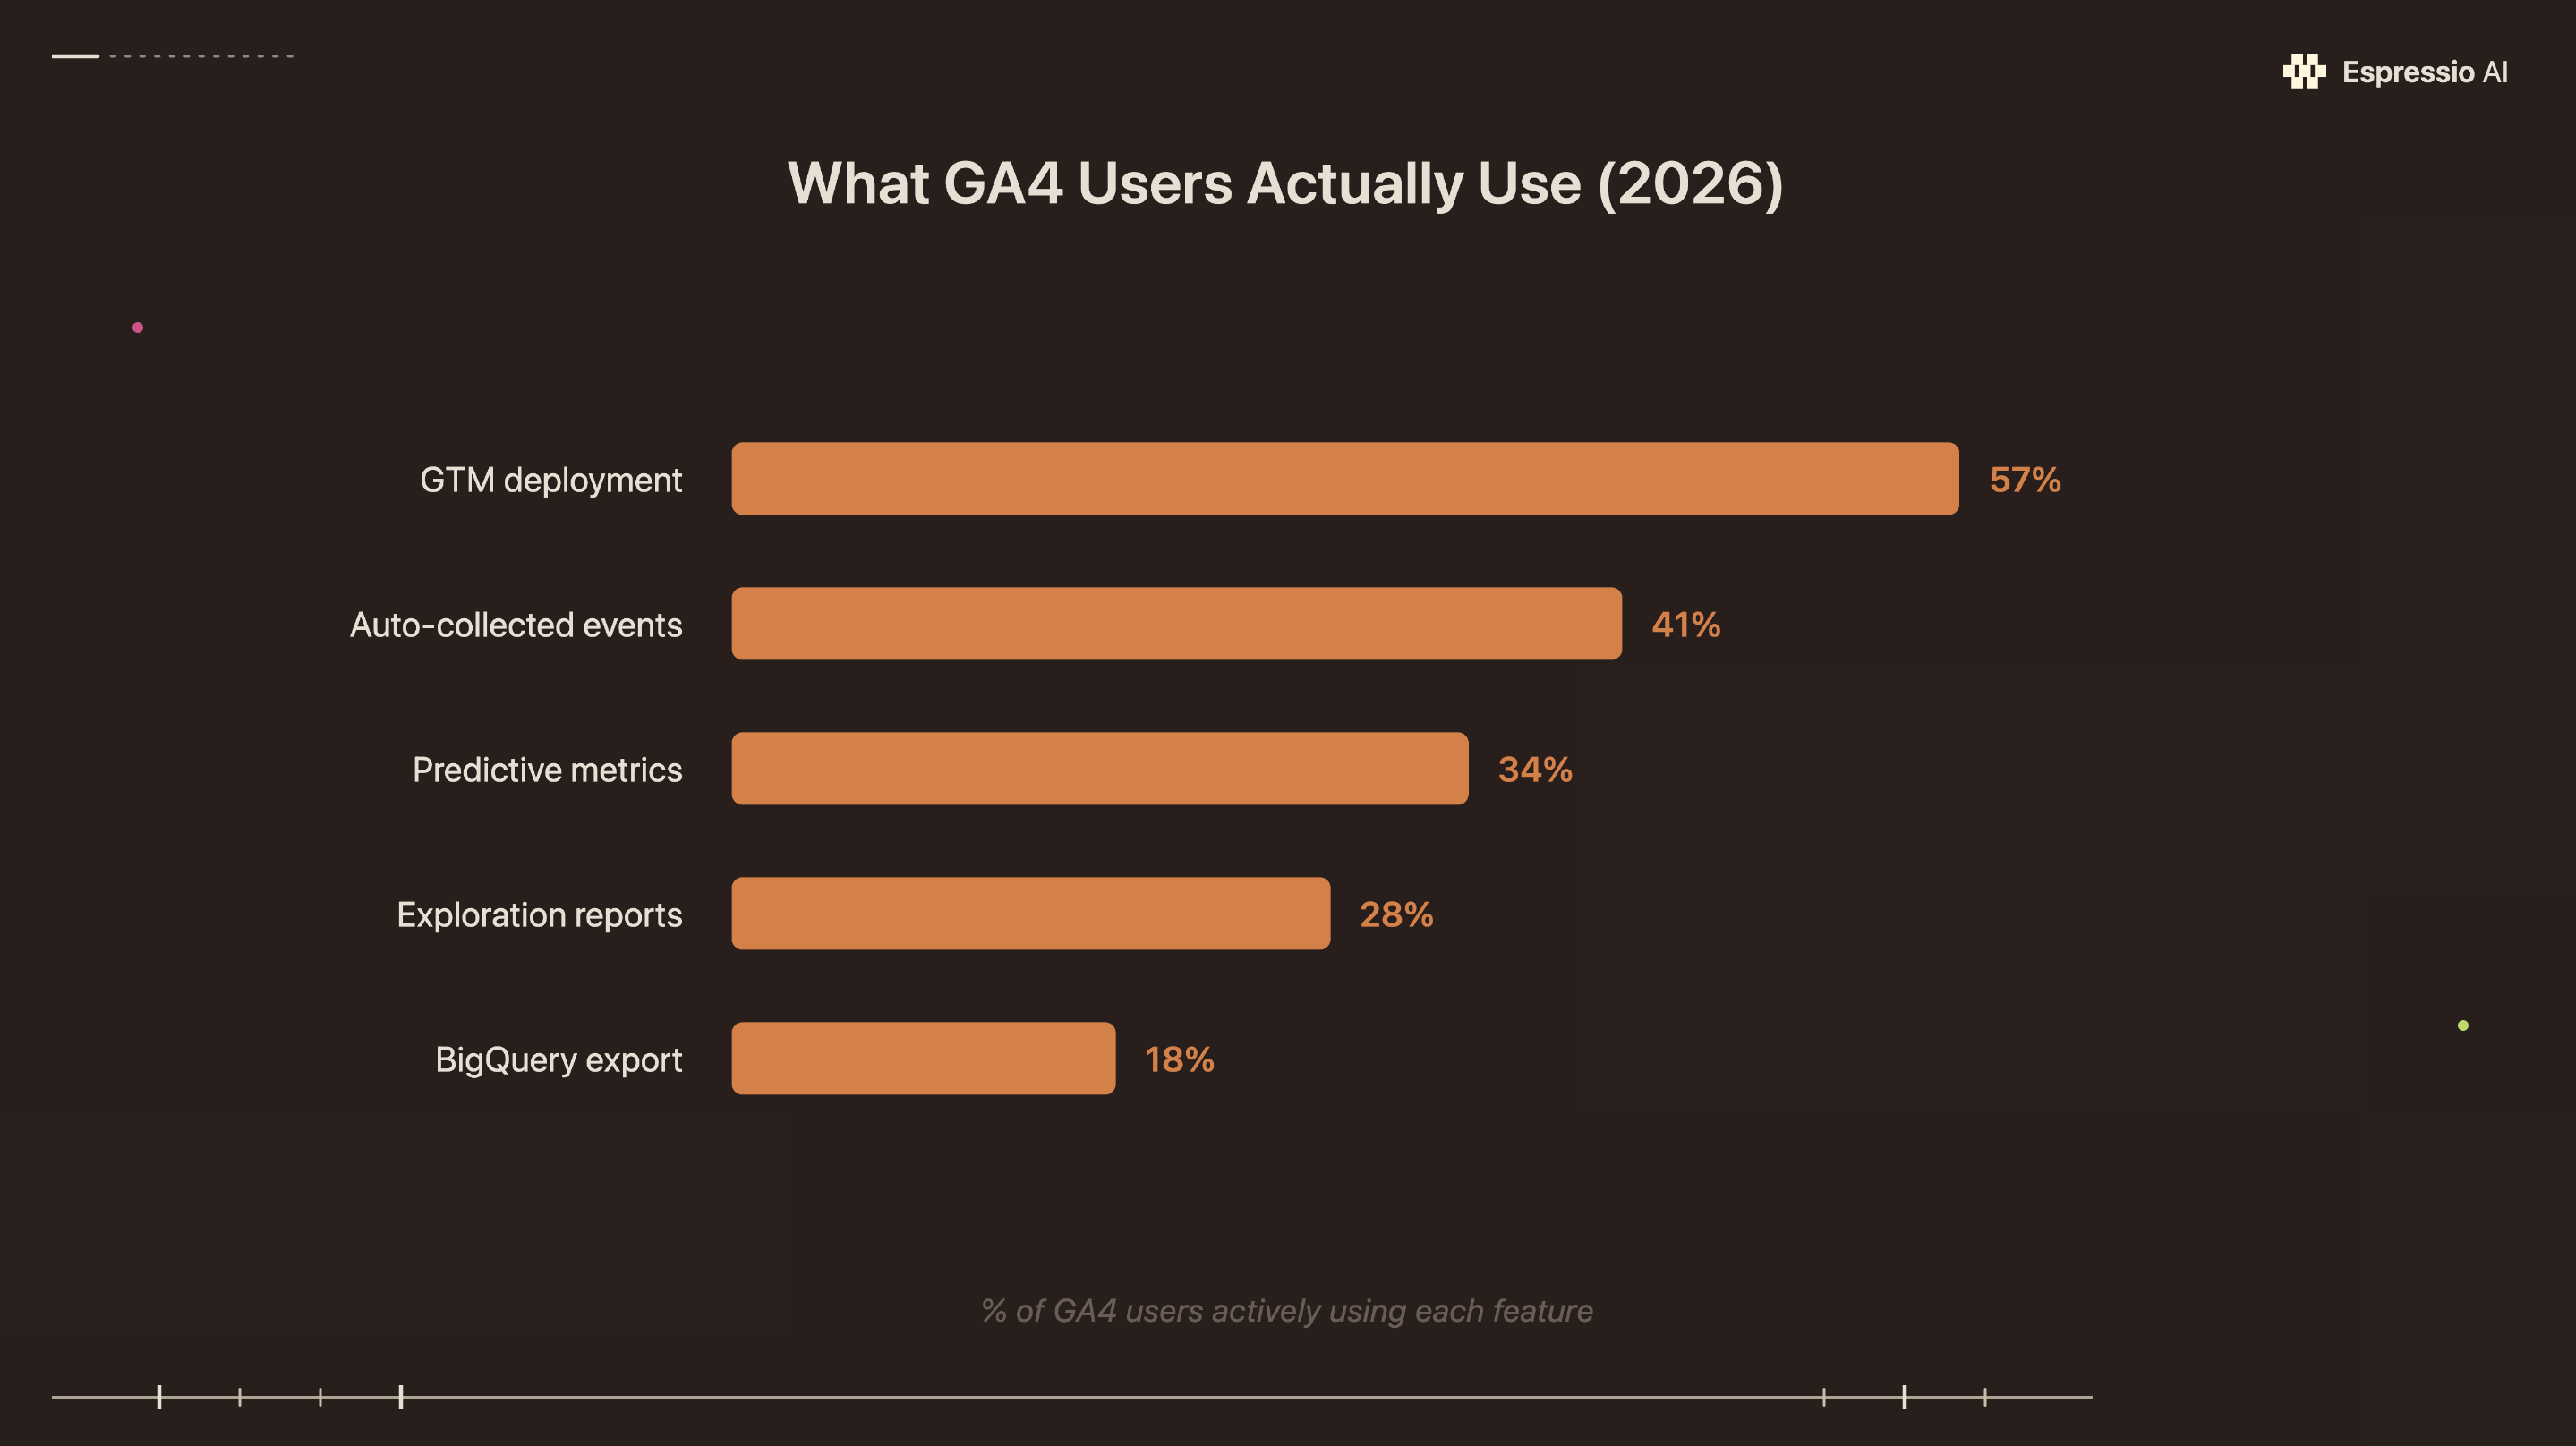
Exploration reports require a 12-step funnel setup just to answer “which landing pages converted?” A manual cohort analysis means building custom segments before running a single query. Most marketing managers don’t have the time, and most reports end up as scheduled summaries that show last week’s numbers without explaining them.
The deeper problem is analyst capacity. 72% of in-house marketers report having data they can’t turn into actionable insights, a figure from a Funnel/Ravn Research survey of 238 marketing professionals (Digital Information World, December 2025). GA4 produces the data; the team rarely has the bandwidth to interpret it at the pace the business moves.
Claude replaces the manual reporting layer between GA4 and the decision that needs to get made.
Four ways to integrate Claude with Google Analytics 4
There are four distinct paths to connecting Claude to GA4. Choosing the wrong one for your team means either a setup too complex to maintain or one that can’t scale beyond a single person’s laptop. The right choice depends on three variables: your team’s technical level, whether you need real-time queries or point-in-time snapshots, and how your organization handles data privacy.
| Method | Technical level | Cost | Real-time? | Best for |
|---|---|---|---|---|
| Google’s official GA4 MCP server | High (Python, CLI, OAuth) | Free (API quotas apply) | Yes | Developers, technical marketing ops |
| No-code connector (Windsor.ai, Coupler.io) | Low (3-step GUI setup) | Paid subscription | Yes | Agencies, non-technical teams |
| Manual CSV export to Claude | None | Free | No (snapshot) | One-off analysis, small teams |
| Custom GA4 Data API + Claude API script | Very high | Pay-per-use (both APIs) | Yes | Engineers, enterprise automation |
For most marketing teams, the decision is between the MCP server (if you have one technically capable person) and Windsor.ai (if you don’t). The CSV method is worth doing today as a proof of concept before committing to any integration. Anthropic now captures 40% of enterprise LLM spending, up from 24% in 2024 and 12% in 2023 (Menlo Ventures, 2025), and Claude-based workflows have become standard marketing ops tooling.
How do you set up the Google Analytics MCP server with Claude?
Google’s official GA4 MCP server gives Claude direct query access to your analytics properties in real time, without exporting a single file. The Two Octobers agency walked through the full setup in a detailed guide (Two Octobers): it requires Python, the Google Cloud CLI, and some tolerance for command-line setup.
What you need before starting:
- Python 3.10 or higher
- A Google Cloud project linked to your GA4 property
- Claude Desktop (free or Pro tier)
- A Google account with GA4 Read & Analyze access
Step 1: Install and authenticate the Google Cloud CLI
Download the gcloud CLI from Google Cloud’s documentation. Run gcloud auth application-default login and sign in with the Google account that has GA4 access. This creates the OAuth credentials the MCP server will use.
Step 2: Enable the GA4 Data API
In Google Cloud Console, navigate to APIs & Services > Library. Search for “Google Analytics Data API” and enable it for your project. Without this step, the MCP server authenticates but returns no data.
Step 3: Install the GA4 MCP server
pip install google-analytics-mcpOr use uvx if you have uv installed: uvx google-analytics-mcp.
Step 4: Add the server to Claude Desktop
Open your Claude Desktop configuration file:
- macOS:
~/Library/Application Support/Claude/claude_desktop_config.json - Windows:
%APPDATA%\Claude\claude_desktop_config.json
Add this entry under mcpServers:
{
  "mcpServers": {
    "google-analytics": {
      "command": "uvx",
      "args": ["google-analytics-mcp"]
    }
  }
}
Step 5: Restart Claude Desktop and test
After restarting, open Claude and type: “List my available GA4 properties.” If the MCP server is connected, Claude will return your property names and IDs. If it returns an error about permissions, check that the GA4 Data API is enabled and that you ran gcloud auth application-default login with the correct account.
Common failure states:
- OAuth scope mismatch: re-run the
gcloud authstep and ensure you select the correct Google account - “Property not found”: confirm the GA4 property ID in your Google Analytics admin panel matches what you’re querying
- API quota exceeded: check your Google Cloud Console quota dashboard; the default core token quota is 200,000 tokens per property per day
20.5% of weekly generative AI users report saving four or more hours per week; among daily users that rises to 33.5% (Federal Reserve Bank of St. Louis, February 2025). The MCP setup compounds. Once it’s running, every GA4 query you’d normally run manually becomes a one-line prompt.
What no-code GA4 connectors work with Claude?
For marketing teams without a developer, Windsor.ai offers a three-step GA4 MCP connector that takes about 10 minutes from account creation to first live query. It exposes 480+ GA4 dimensions and metrics to Claude without any command-line work, OAuth setup, or Python installation.
Windsor.ai setup:
- Create a Windsor.ai account and connect your GA4 property under Data Sources
- Navigate to Destinations > MCP and copy your personal MCP server URL
- Add that URL to your Claude Desktop config under
mcpServers, then restart
Coupler.io is the better option if your team pulls from multiple platforms: GA4 plus Meta Ads, LinkedIn, Google Ads, or Shopify. The setup is similar but Coupler’s MCP surfaces data from all connected sources simultaneously, so Claude can answer cross-channel questions without switching between tools.
Both connectors route your GA4 data through their servers before it reaches Claude. That’s the key trade-off: you’re gaining a simpler setup at the cost of adding a third party in the data path. For client data or regulated industries, review both vendors’ data processing agreements before connecting.
When we connected Windsor.ai for a boutique e-commerce client last quarter, the setup took 11 minutes. The first report they requested, a 30-day channel breakdown ranked by conversion rate, would have taken their marketing manager roughly 45 minutes to build manually inside GA4’s interface. Claude returned a structured table in under two minutes, with all five traffic sources ranked and a one-line note on which channel showed the highest assisted-conversion rate. That report now runs every Monday morning without anyone opening GA4.
For teams building broader AI-assisted workflows, see how agencies are structuring AI reporting pipelines at scale.
For teams without technical staff, the no-code path removes the configuration barrier entirely. The setup that would take a developer an afternoon to debug via the CLI takes about 10 minutes through a GUI connector, with the same reporting output on the other side.
How do you analyze GA4 data in Claude without any setup?
If you want to test what Claude can do with your analytics data today, with nothing beyond a free Claude.ai account, the CSV export method works in under 10 minutes.
How to export from GA4:
- Open GA4 and navigate to any standard report (e.g., Reports > Acquisition > Traffic acquisition)
- Set your date range
- Click the Download icon (top-right corner of the table) > Download CSV
- Open Claude and paste the CSV content directly into the chat
How to structure your prompt:
Don’t paste the CSV and ask “what do you see?” Give Claude context:
“This is GA4 traffic acquisition data for [website] from [start date] to [end date]. Summarize the top 5 channels by sessions, calculate each channel’s share of total sessions, and flag any channel that declined more than 10% compared to the prior period.”
Claude will return a structured summary, ranked table, and percentage calculations from the raw CSV in seconds.
Limitations to know:
- The CSV is a static snapshot; it reflects data at the time of export with no live updates
- Large exports (25,000+ rows) may hit Claude’s context limit; for very large datasets, filter or aggregate in GA4 before exporting
- The free Claude.ai tier has usage limits; heavy weekly reporting works better on Claude Pro or the API
The CSV method is the fastest way to validate whether Claude-generated reports meet your team’s quality bar before investing in a live integration.
What should you ask Claude once your GA4 integration is live?
Claude’s median task completion time is 84% faster than doing the same work manually. In a study of 100,000 real Claude.ai conversations, tasks took an average of 1.4 hours without Claude (Anthropic, 2025). For GA4 reporting, that translates to a typical 90-minute weekly report becoming a 15-minute conversation. That gap only closes with well-structured prompts.
These six prompts cover the most common marketing reporting use cases:
1. Weekly exec summary
“Pull GA4 data for [property] from [Monday] to [Sunday]. Summarize total sessions, top 5 channels by sessions, conversion rate by channel, and week-over-week change for each. Format as a three-paragraph exec summary suitable for a leadership standup.”
2. Campaign performance comparison
“Compare [Campaign A] vs. [Campaign B] on sessions, goal completions, and bounce rate from [date range]. Which campaign performed better, and what does the data suggest about why?”
3. Top organic landing pages
“Show me the top 10 landing pages by organic sessions this month. For each, include sessions, average engagement time, and conversion rate. Flag any page where engagement time is above average but conversion rate is below average.”
4. Anomaly detection
“Identify any traffic anomalies in the past 30 days, specifically days where sessions deviated more than 20% from the 90-day rolling average. List the dates and likely causes based on surrounding data patterns.”
5. Audience segment comparison
“Break down new vs. returning users by device category for the past 60 days. Which segment has the highest engagement rate, and what does that suggest about our mobile experience for returning visitors?”
6. Month-over-month trend report
“Generate a month-over-month comparison for [property] covering the last six months. Include sessions, conversions, and conversion rate. Identify the trend direction and flag any month with a statistically notable shift.”
The prompts that produce the sharpest outputs share two structural features: they specify the output format (table, summary, ranked list), and they give Claude a hypothesis to test or a threshold to flag against. “What happened to traffic last month?” returns a general summary. “Which channels dropped more than 15% and what might explain it?” returns something you can act on. The format specification sets the analysis depth Claude applies to the data.
For a complementary workflow, connecting Claude to HubSpot closes the loop between GA4’s acquisition data and CRM conversion records.
What should you know about data privacy for GA4 and Claude?
Sending GA4 data to Claude means that data passes through Anthropic’s infrastructure. Every competitor guide on this topic skips the privacy question entirely.
The distinction most teams miss: the GA4 Data API returns aggregated metrics by default. When you connect Claude to GA4 via the MCP server or a no-code connector, Claude receives counts, rates, and totals. No individual user records are included. Under GDPR, aggregated analytics data is generally not “personal data” because no individual can be identified from it. The compliance risk changes when you pull user-level data via the GA4 Data API’s userActivity endpoint, or when you export User Explorer reports from the GA4 interface and paste them directly into Claude. Keep aggregated metrics and user-level exports in separate workflows; the compliance case stays straightforward.
Practical steps before you connect:
- Use the Claude API or Claude for Teams, not the free Claude.ai tier, for any client or proprietary data. The Claude API’s data handling policy explicitly states that Anthropic doesn’t use conversation data to train its models by default. The free web tier has different retention terms.
- Check your Anthropic subscription tier’s data processing agreement if your GA4 property contains EU user data and your organization operates under GDPR. Anthropic offers a Data Processing Addendum (DPA) for enterprise customers.
- Document your data flow. If you’re handling client GA4 data as an agency, your data processing records under GDPR Article 30 should reflect that client analytics data passes through Claude for report generation. A straightforward entry, but it needs to exist.
- Avoid pulling user-segment data that could identify individuals. City-level breakdowns and device categories are fine. Small-n cohorts (e.g., “users who visited page X in the last 7 days” when that’s 12 people) are not.
56% of early AI adopters exceed their business goals versus 28% of planners who haven’t yet deployed (ThoughtSpot, 2026). The compliance groundwork takes an hour. Every week of delay is another week your team interprets GA4 data too slowly to influence campaign decisions.
If you’re looking to integrate AI into your marketing workflows, from analytics and reporting to content and lead generation, get in touch with us and we’ll map out where automation adds the most value for your team.
Frequently Asked Questions
Is the Google Analytics MCP server free to use?
The GA4 MCP server itself is open source (Apache 2.0 license) and free. The GA4 Data API’s default quota is 200,000 core tokens per property per day, with a maximum of 10 concurrent requests. For high-volume reporting across many properties, monitor your Google Cloud Console quota dashboard and request increases if needed.
Can Claude access real-time GA4 data, or only historical reports?
With the MCP server or a no-code connector, Claude queries the GA4 Data API in real time. Data freshness matches GA4’s own processing lag: standard reports update within 24–48 hours, while real-time dimensions (active users, current sessions) update within minutes. The CSV export method is always a static snapshot from the time of download.
Does connecting GA4 to Claude create GDPR compliance issues?
Not by default. The GA4 Data API returns aggregated metrics, which are generally not “personal data” under GDPR because no individual is identifiable. Compliance issues arise only when pulling user-level data (User Explorer exports, the userActivity API endpoint). For client data or EU-based properties, use the Claude API tier rather than the free web interface and obtain Anthropic’s Data Processing Addendum if required.
What’s the fastest way to start using Claude for GA4 analysis today?
The CSV export method requires no setup and no subscription beyond a free Claude.ai account. Export any GA4 standard report as CSV, paste it into Claude with a specific question (include the date range, property name, and what you want to learn), and Claude will return a structured analysis in seconds. Use this method first to validate that Claude’s output quality meets your team’s bar before building a live integration.
Can Claude connect to multiple GA4 properties at once?
Yes. With the MCP server, you configure access at the Google Cloud project level, and the GA4 Data API supports querying multiple property IDs. No-code connectors like Windsor.ai and Coupler.io also support multi-property configurations from a single connected account. You can ask Claude to pull from “our main property and the staging property” in a single prompt once both are configured.
Conclusion
The four methods covered here serve different teams at different stages. The CSV export costs nothing and proves the concept in 10 minutes. Windsor.ai or Coupler.io gets a non-technical team to live queries in under an hour. The official GA4 MCP server is the highest-leverage setup for teams that want real-time data and no recurring subscription cost, at the price of a one-time technical configuration.
The privacy question is simpler than most people expect once you understand the aggregated-vs.-user-level distinction. Start with aggregated metrics, document the data flow, and use the Claude API tier for anything client-facing.
Google continues adding dimensions to the GA4 MCP server’s query surface. Teams running these workflows now gain a compounding advantage: each new integration folds into an analytics layer that’s already running.
For the next integration to pair with GA4, see how to connect Claude to HubSpot for sales reporting. The two together cover acquisition-to-close in a single AI-assisted workflow. If you’re thinking at the operating system level, how to build an AI operating system for your agency shows what that looks like end to end.