
Kimmo Hakonen
Chief Innovation Officer
Insights, strategies, and real-world playbooks on AI-powered marketing.
JUN 25, 2026
How to Build a Retool Dashboard for AI Marketing Analytics

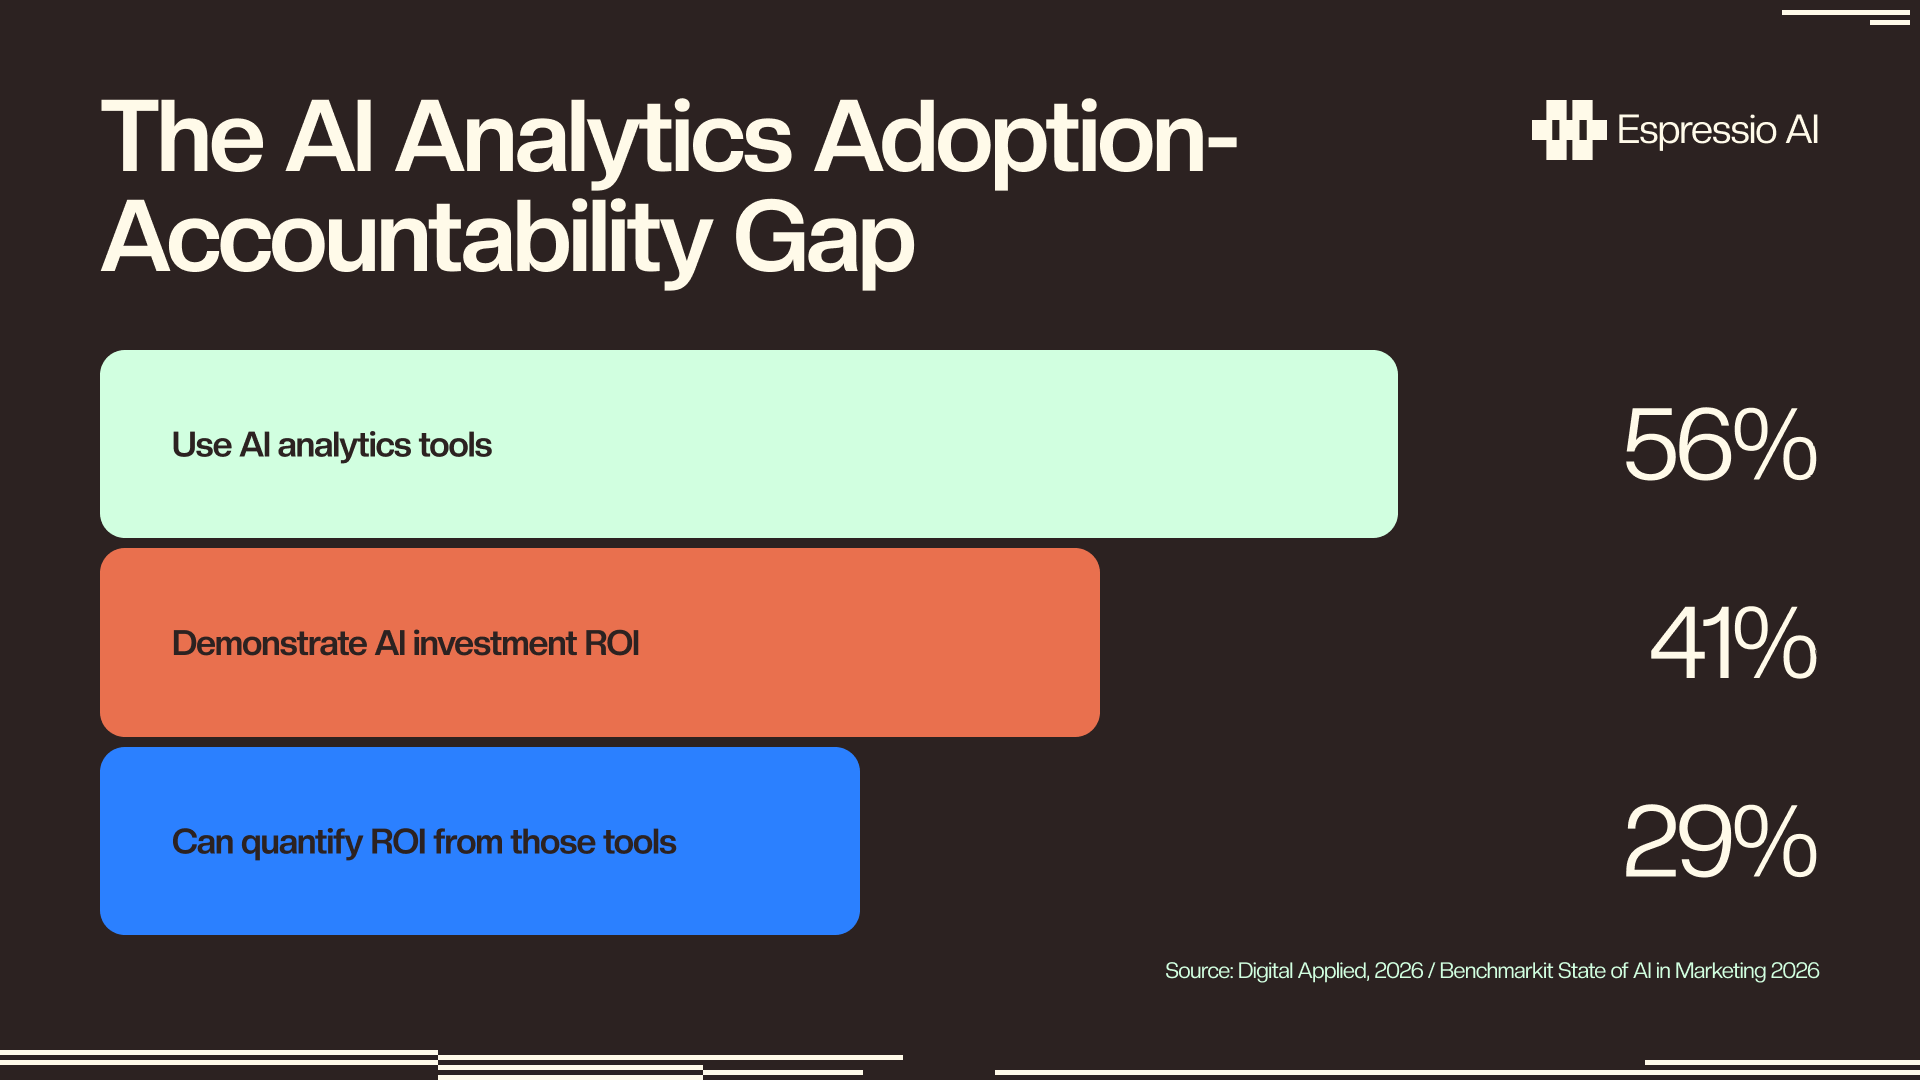
56% of marketing teams use AI-powered analytics tools, but only 29% can quantify ROI from them (Digital Applied, 2026). The gap lives in the dashboard layer.
Most growth teams have HubSpot, GA4, Google Ads, and Salesforce data in separate tabs. A BI vendor contract merges the tabs but introduces a new set of problems: months of onboarding, a data engineer as the permanent bottleneck, and $2,000 to $5,000 per month before a single chart ships. Retool takes a direct path instead. Connect to your APIs, drag components onto a canvas, write one JavaScript transformer. The core three-panel dashboard is ready in a day.
Add an LLM text panel (a Retool Query component calling the Claude API with your pipeline data as context) and your CMO gets a natural language performance summary alongside every chart.
Key Takeaways
- 56% of marketing teams use AI analytics tools, but only 29% can quantify ROI from them; Retool dashboards with an LLM insights panel close that gap directly (Digital Applied, 2026).
- A Retool marketing analytics dashboard connects HubSpot, GA4, Google Ads, and Salesforce in one view with no BI vendor contract.
- The AI insights layer sends your HubSpot pipeline output to Claude or OpenAI API and displays a 3-sentence performance summary alongside your KPI charts.
- Role-based views for CMO summaries and analyst drill-downs configure through Retool’s built-in permission groups. One conditional expression handles tab visibility per group.
Why build a Retool marketing analytics dashboard instead of buying Tableau or Looker?
Organizations with mature analytics achieve 23% higher marketing ROI and are 2.7x more likely to exceed revenue targets (Digital Applied, 2026). Mature analytics comes from a dashboard that connects to live data in time for Monday’s standup, with no BI vendor required.
Tableau and Looker require a data warehouse, a BI admin, and 3 to 8 weeks of onboarding before a first chart is visible. Retool connects directly to REST APIs and databases through a visual configuration interface, with no intermediary data pipeline. The pricing gap matches: Tableau’s Creator tier starts at $70/user/month and assumes a warehouse is already running; Retool’s internal tool plan starts at $10/user/month and talks directly to your APIs.
Retool reached $120M ARR at a $3.2B valuation as of October 2025 (Sacra, 2025). That growth reflects adoption by engineering and RevOps teams at growth-stage companies who need to ship internal tools without adding headcount.
Three scenarios where Retool wins over a BI vendor:
- Direct API connections. HubSpot, GA4, Google Ads, and Slack are configurable as Retool resources without a data pipeline intermediary.
- No SQL required for most panels. JavaScript transformers handle aggregation, date windowing, and ratio calculations in the query editor.
- One platform for dashboards and automations. Retool Automations handles scheduled refresh and Slack alerting from the same workspace.
We built the initial three-panel HubSpot + GA4 dashboard in under four hours for an Espressio client marketing team. The LLM insights panel added another 90 minutes. That same team had waited six weeks for a Looker dashboard from their data team before switching to Retool. The four-hour build time is now a consistent baseline across similar projects.
Citation Capsule: Organizations with mature marketing analytics achieve 23% higher marketing ROI and are 2.7x more likely to exceed revenue targets (Digital Applied, 2026). Retool lets growth-stage teams reach that maturity level without a BI vendor contract or a dedicated data engineering hire, by connecting directly to HubSpot, GA4, and Salesforce APIs in a visual interface that ships in hours rather than weeks.
What data sources should your Retool marketing analytics dashboard connect to?
44% of marketers analyze campaign performance weekly, but only 32% trust their data quality enough to act on it (HubSpot, 2026; Revenue Memo, 2026). The trust problem starts at the source layer. A unified source configuration in Retool fixes it before you draw the first chart.
The core stack for a B2B growth team:
- HubSpot: deals, contacts, pipeline velocity, lead stage progression. Use Retool’s native HubSpot connector or a REST API resource with your Private App token.
- Google Analytics 4: sessions, engagement rate, conversion events by source/medium. Configure via the GA4 Data API with a Google service account credential.
- Google Ads: campaign spend, clicks, conversions, CPC by campaign. Configure via the Google Ads REST API resource with an OAuth developer token.
- Salesforce: closed-won revenue, opportunity stage, account health. Configure via a Salesforce REST resource with connected app credentials.
- PostgreSQL or BigQuery: warehoused marketing data for teams already running a lightweight warehouse.
Adding a HubSpot resource in Retool
- In your Retool app, go to Resources > Create new resource.
- Select HubSpot from the connector list.
- Paste your HubSpot Private App access token.
- Test the connection. A successful response returns your portal ID.
Adding a GA4 resource
- Create a Google service account in Google Cloud Console.
- Grant the service account “Viewer” access to your GA4 property.
- Download the JSON key file.
- In Retool, create a Google Analytics resource and upload the JSON key.
- Note your GA4 property ID (format:
properties/123456789) for use in every query.
In practice, HubSpot and GA4 cover 80% of what a growth team actually queries daily. Salesforce matters once the dashboard reaches a VP-of-Sales audience. Google Ads requires the most setup time because the OAuth developer token needs Google approval — budget an extra 30 minutes for that step.
Citation Capsule: 44% of marketers analyze campaign performance weekly, but only 32% trust their data quality enough to support data-driven decisions (HubSpot, 2026; Revenue Memo, 2026). Connecting HubSpot, GA4, Google Ads, and Salesforce to a single Retool app eliminates the trust gap by removing manual data exports and the stale numbers they create.
How do you build the pipeline velocity, CAC, and channel attribution panels in Retool?
85% of marketers say they can measure marketing ROI holistically, but only 32% actually do (Nielsen, 2025 Marketing ROI Blueprint, via coupler.io, 2025). A three-panel Retool layout puts pipeline velocity, CAC, and channel attribution on one screen and closes that measurement gap without a sprint.
Connecting the data takes 30 minutes per source. The real challenge is knowing which three panels actually get used in a weekly CMO review.
Panel 1: Pipeline velocity (HubSpot query)
Create a query using the HubSpot resource to fetch deals created in the last 30 days with stage, amount, and close date. Add a JavaScript transformer to calculate velocity: deals_created × average_deal_size / average_days_to_close. Display the result in a Stat component (the single-number component) and a Chart component set to line type with a 90-day window.
Panel 2: CAC by channel (HubSpot + Google Ads query)
Write a JavaScript transformer dividing total Google Ads spend (from your Google Ads query) by new contacts attributed to paid channels (from your HubSpot contacts query). Drop the result into a Table component with channel as the row dimension. Add a Chart component in grouped bar mode to visualize channel comparison.
Panel 3: Multi-channel attribution (GA4 + HubSpot combined)
Pull traffic by session_source_medium from GA4 and join with HubSpot new contact data using a shared time window. A grouped bar Chart component showing organic, paid, and direct attribution side by side is the output most CMOs actually read.
The component configuration that works best for a weekly CMO review: Stat component and single-line Chart at the top, Table with row-level filtering below. CMOs read the Stat and the trend line; analysts filter the Table. Both on the same screen means no separate views until the dataset grows past 500 rows and Table rendering slows down.
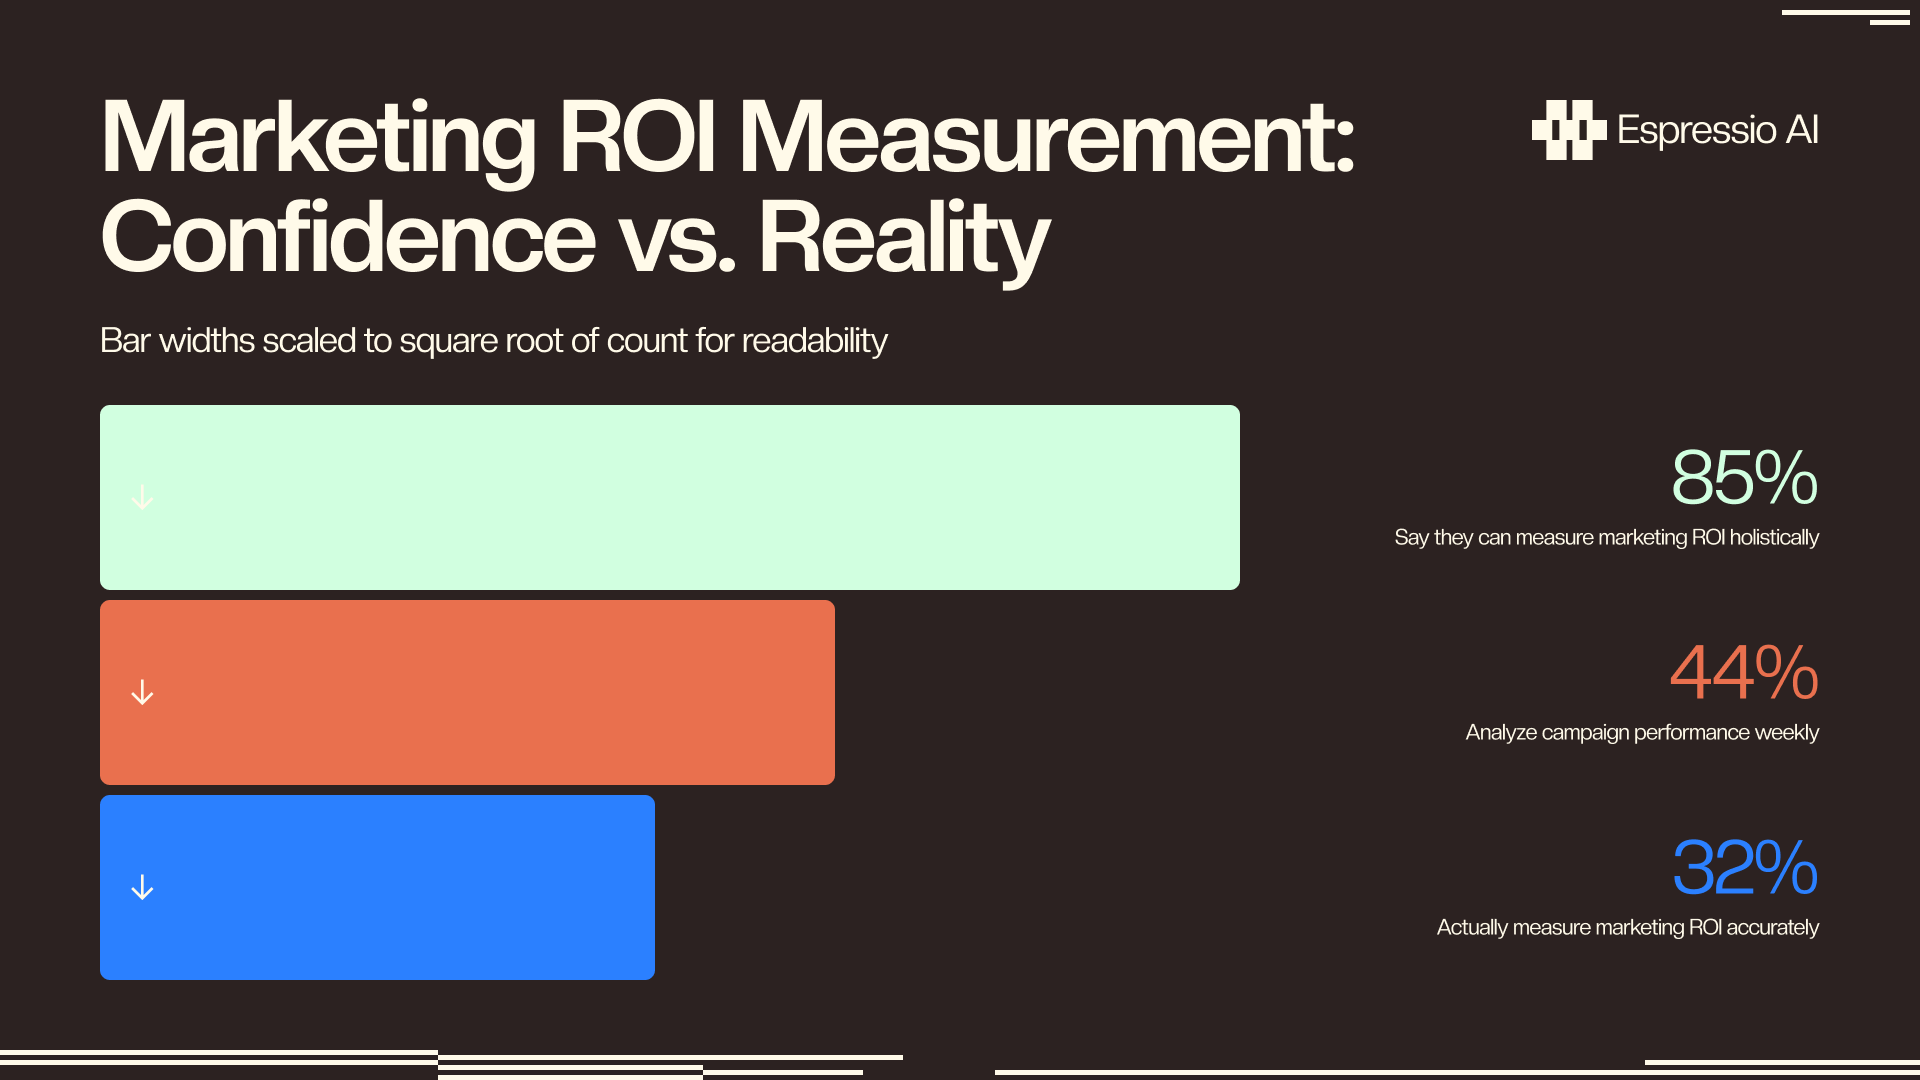
Citation Capsule: 85% of marketers say they can measure marketing ROI holistically, but only 32% actually do (Nielsen, 2025 Marketing ROI Blueprint, via coupler.io). A three-panel Retool layout covering pipeline velocity, CAC by channel, and multi-channel attribution is the minimum configuration that closes the measurement gap without a data warehouse or a BI admin.
How do you add an AI insights layer with an LLM text panel?
Top-quartile AI analytics adopters report 3.2x higher marketing ROI compared to non-adopters (Digital Applied, 2026). Teams in that quartile share one thing: they surface an interpretable insight from their data without scheduling a separate analysis meeting.
What separates the 32% who can actually demonstrate ROI from the other 68%? In most cases, the answer is a translation layer: something that converts pipeline numbers into language a CMO can act on in the same dashboard where the raw data lives.
The Retool LLM text panel is the pattern every SERP competitor misses entirely. The exact setup:
Step 1: Create a new Query in Retool and select your REST API resource configured for Claude or OpenAI. For Claude, set the URL to https://api.anthropic.com/v1/messages and add headers: anthropic-version: 2023-06-01 and x-api-key: {{claude_api_key}}.
Step 2: Build the request body. Inject the current dashboard query output as JSON context:
{
  "model": "claude-opus-4-8",
  "max_tokens": 300,
  "messages": [
    {
      "role": "user",
      "content": "Here is last week's pipeline data: {{JSON.stringify(pipelineQuery.data)}}. Write a 3-sentence summary: what changed, what drove the change, and what to watch next week."
    }
  ]
}
Step 3: Display the response in a Text component placed above your KPI charts. Set the component value to {{ llmInsightsQuery.data.content[0].text }}. The panel updates on every dashboard refresh.
Claude’s context window handles full HubSpot deal export payloads cleanly without truncation, which matters for dashboards with more than 50 active deals in the query window.
CMOs read the summary; analysts read the Table. Same data, two audiences, one Retool app. The LLM text panel collapses what used to be a Monday morning analytics meeting into a Slack notification with the summary pre-written. The meeting shifts from an open question to a resolved one. No competitor at any level of the SERP documents this pattern for a Retool marketing dashboard.
For the Claude API configuration behind this step, see how to set up Claude API for marketing teams.
Citation Capsule: Top-quartile AI analytics adopters report 3.2x higher marketing ROI versus non-adopters (Digital Applied, 2026). A Retool LLM text panel (a Query component calling Claude or OpenAI API with the current dashboard data as context) is the mechanism that converts raw pipeline numbers into the natural language insight that drives that ROI gap.
How do you configure role-based views for CMO versus analyst access?
Only 41% of marketers can demonstrate AI investment ROI, down from 49% the prior year (Benchmarkit State of AI in Marketing 2026, n=1,400, via coupler.io, 2026). Dashboards designed for analysts push CMOs into granularity they can’t act on. CMO-level summaries hide the drill-down analysts need to diagnose problems.
Building two separate Retool apps doubles your maintenance burden. Retool’s permission groups solve this within the same app.
Step 1: Create Permission Groups in your Retool workspace settings. Add two groups: cmo and analyst. Assign team members.
Step 2: Add a Tab component to the dashboard canvas. Label Tab 1 “Summary” and Tab 2 “Analysis”.
Step 3: Apply conditional visibility using Retool’s current_user object:
- Summary tab visible to everyone.
- Analysis tab visible only when:
{{ current_user.groups.includes('analyst') }}
Step 4: Populate the Summary tab with three Stat components (pipeline velocity, CAC trend, conversion rate), the LLM text panel from H2-4, and one high-level Chart. No filters. No raw tables.
Step 5: Populate the Analysis tab with full Table components, a DateRangePicker for time-window selection, channel-level Chart breakdowns, and raw query outputs.
Citation Capsule: Only 41% of marketers can demonstrate AI investment ROI (down from 49% the prior year), while 60% of those who can report 2x or better returns (Benchmarkit State of AI in Marketing 2026, n=1,400, via coupler.io). Role-based Retool views separate CMO-level summaries from analyst drill-downs, addressing the most common reason dashboards get ignored after week one.
How do you automate data refresh and set up Slack alerts for marketing KPIs?
The global marketing analytics market is projected to grow from $7.12B in 2025 to $14.55B by 2031 at a 12.65% CAGR (Revenue Memo, 2026). Gartner forecasts AI automation of marketing work will double from 16% to 36% between 2026 and 2028 (Gartner, May 2026). What happens when CAC spikes at 11pm on a Tuesday and nobody’s watching the dashboard? Retool Automations answers that question without additional infrastructure.
Step 1: Create an Automation in your Retool workspace. Go to Automations > Create new.
Step 2: Add a Schedule trigger. Set it to run every Monday at 8:00 AM in your team’s timezone.
Step 3: Add query steps to pull the current pipeline velocity and CAC values. Copy the query configuration directly from your dashboard’s existing queries.
Step 4: Add a Slack step using your Retool Slack resource. Configure the message body:
Weekly Marketing Pulse — {{ new Date().toLocaleDateString() }}
Pipeline velocity: {{ pipelineQuery.data.velocity }} deals/week
CAC (paid): ${{ cacQuery.data.paid_cac }}
{{ llmInsightsQuery.data.content[0].text }}
Step 5: Add a conditional alert branch. If cacQuery.data.paid_cac > threshold, send a second Slack message to #marketing-ops flagging the anomaly.
Citation Capsule: Gartner forecasts AI automation of marketing work will double from 16% to 36% between 2026 and 2028 (Gartner, May 2026). Retool Automations closes the loop between the dashboard and the team, scheduling weekly pipeline summaries to Slack and firing threshold alerts to
#marketing-opswithout additional infrastructure or a separate monitoring tool.
If you want us to build this for your team, let’s chat.
Frequently Asked Questions
Is Retool free for marketing analytics dashboards?
Retool offers a free plan for up to 5 users on internal tools. Paid plans start at $10/user/month. For teams evaluating platform risk, Retool reached $120M ARR at a $3.2B valuation as of October 2025 (Sacra, 2025) — a signal of platform stability for long-term dashboard investments.
Does Retool connect to HubSpot natively?
Yes. Retool’s native HubSpot connector (introduced in 2024) supports CRM objects, deals, contacts, and pipeline stages. 44% of marketers analyze campaign performance weekly (HubSpot, 2026) — and a native connector means that analysis runs against live CRM data, not yesterday’s export.
Can I use Claude or OpenAI directly inside a Retool dashboard?
Yes, via Retool’s REST API Query component. Configure the endpoint, headers, and JSON request body as described in the LLM panel section above — no plugin or middleware required. Top-quartile AI analytics adopters report 3.2x higher marketing ROI (Digital Applied, 2026). The LLM text panel is the mechanism.
How long does it take to build a Retool marketing analytics dashboard?
The core three-panel dashboard (HubSpot, GA4, and Google Ads) takes 3–5 hours. The LLM insights panel adds 90 minutes; role-based views add about 1 hour. We’ve consistently built production-ready Retool marketing dashboards in a single working day, compared to 3–8 weeks for BI vendor onboarding cycles.
What’s the difference between Retool and Looker for marketing analytics?
Looker requires a data warehouse, a BI admin, and a minimum $5,000/month at the starter tier. Retool connects directly to APIs and databases at $10–$50/user/month. For marketing teams under 20 users, Retool ships a working dashboard in one day versus a BI vendor’s typical 3–8 week onboarding cycle.
Conclusion
Four steps get you from zero to a production Retool marketing analytics dashboard in a single workday:
- Connect your sources: HubSpot native connector, GA4 service account, Google Ads OAuth, Salesforce REST resource.
- Build three KPI panels: pipeline velocity, CAC by channel, multi-channel attribution using Stat, Chart, and Table components.
- Add the LLM text panel: a Retool Query calling Claude API with your pipeline data as context. CMO reads the summary; analyst reads the Table.
- Automate the loop: Retool Automations sends the weekly pulse to Slack every Monday at 8am and alerts
#marketing-opson threshold breaches.
The number that shifts: from 29% of teams able to quantify AI analytics ROI to a team that reports it in a Monday morning Slack message. That’s the gap this build closes.
If you want us to build this for your team, let’s chat.
For more on the Claude API configuration used in the LLM text panel, see how to set up Claude API for marketing teams.