
Kimmo Hakonen
Chief Innovation Officer
Insights, strategies, and real-world playbooks on AI-powered marketing.
JUN 16, 2026
How to Use Claude Fable 5 Vision for PDFs, Charts, and Document Workflows

Eighty to ninety percent of newly generated enterprise data is unstructured, and only 18% of organizations are actively processing it (Market.us, 2026). The documents that matter most carry their critical information in charts, tables, and annotated figures. Standard PDF text extraction passes over all of it.
Claude Fable 5’s vision layer changes that equation. The 3× token multiplier most teams miscalculate explains why architecture choices matter; the benchmark data and workflow patterns below cover the rest.
Key Takeaways
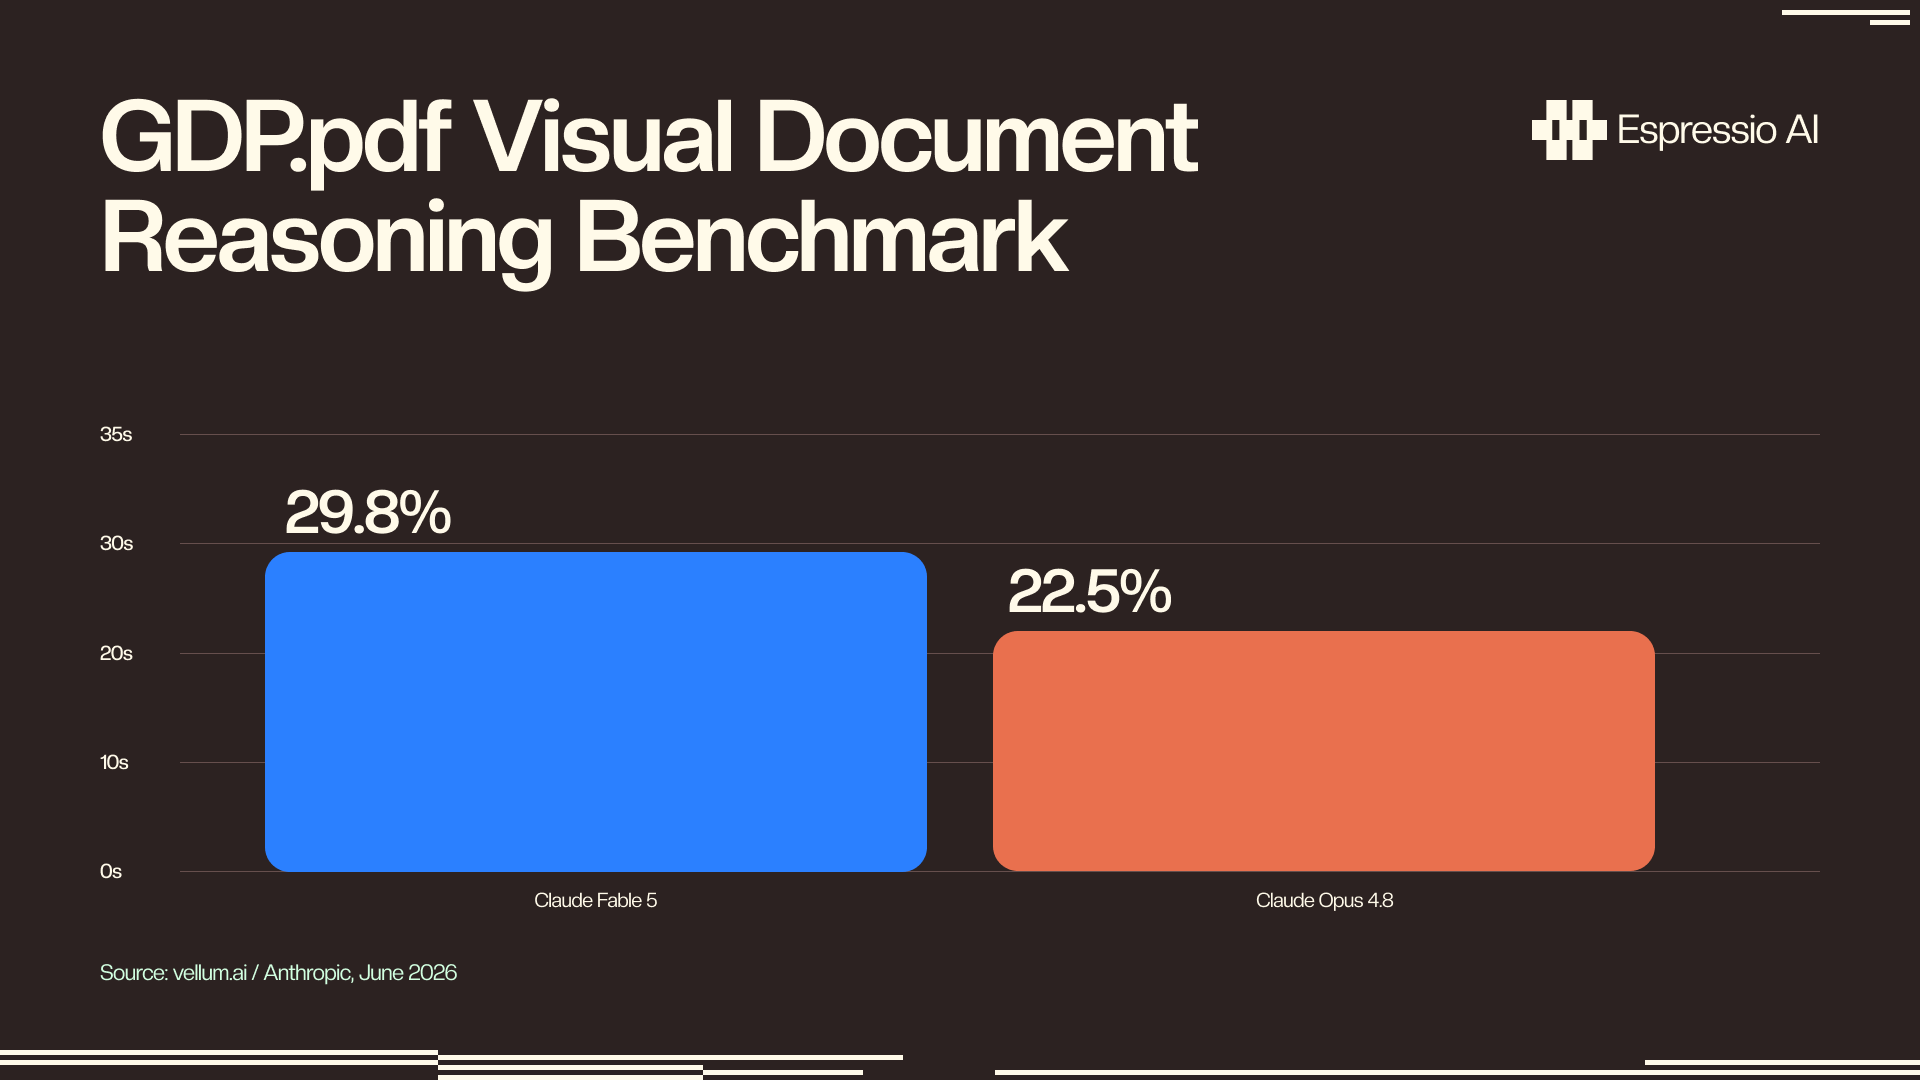
- Claude Fable 5 leads Hebbia’s senior-level finance benchmark and scores 29.8% on GDP.pdf visual document reasoning, versus 22.5% for Opus 4.8 (Anthropic / vellum.ai, June 2026).
- High-resolution images cost approximately 4,784 tokens per page in high-res mode versus 1,568 tokens at standard resolution, a 3× multiplier that changes the economics of chart-heavy documents (Anthropic API docs, 2026).
- The Files API eliminates repeated upload costs for recurring documents; Batch API at 50% off makes nightly extraction cycles viable at scale (Anthropic API docs, 2026).
- IDP automation cuts processing time 50%+, reduces errors by 52%+, and delivers 30–200% ROI in year one (Market.us, 2026).
What makes Fable 5’s vision layer different from prior Claude models?
Claude Fable 5 scored first on Hebbia’s senior-level finance benchmark, with what Anthropic describes as “substantial gains” in chart and table interpretation over Opus 4.8 (Anthropic, June 2026). It was also the first model to reach 90% on Hex’s complex analytics benchmark, a 10-point jump over Opus 4.8 on tasks that require reasoning over data visualizations rather than simply describing them.
That benchmark lead compounds across volume. An analyst reviewing 50 financial reports monthly now gets materially more complete data extraction with fewer manual corrections per report.
Prior Claude models processed PDF pages as flattened images at a fixed resolution. Fable 5 operates with a true high-resolution vision pass that preserves fine detail: axis labels, data point annotations, legend entries, and footnote references. For teams whose documents contain charts with 8-point font labels or tables with merged cells, this is the difference between usable extraction and garbage data.
Claude Fable 5’s lead on Hebbia’s senior-level finance evaluation and Hex’s complex analytics benchmark makes it the strongest publicly evaluated model for document comprehension (vellum.ai, June 2026). For finance and legal teams whose workflows depend on reliable extraction from PDF-native documents, that benchmark advantage translates directly to fewer corrections per report and more complete downstream data.
How does Claude Fable 5 read PDFs — and what does it actually cost?
Claude Fable 5 supports up to 600 pages per request, handles files up to 32MB, and processes each page as two layers: a text extraction pass and a vision pass that renders the page as an image (Anthropic API docs, 2026). Estimated token consumption runs 1,500–3,000 tokens per page for the text layer, plus image tokens on top. At $10/M input, a 600-page report costs roughly $9–18 in text-layer tokens alone before the vision layer.
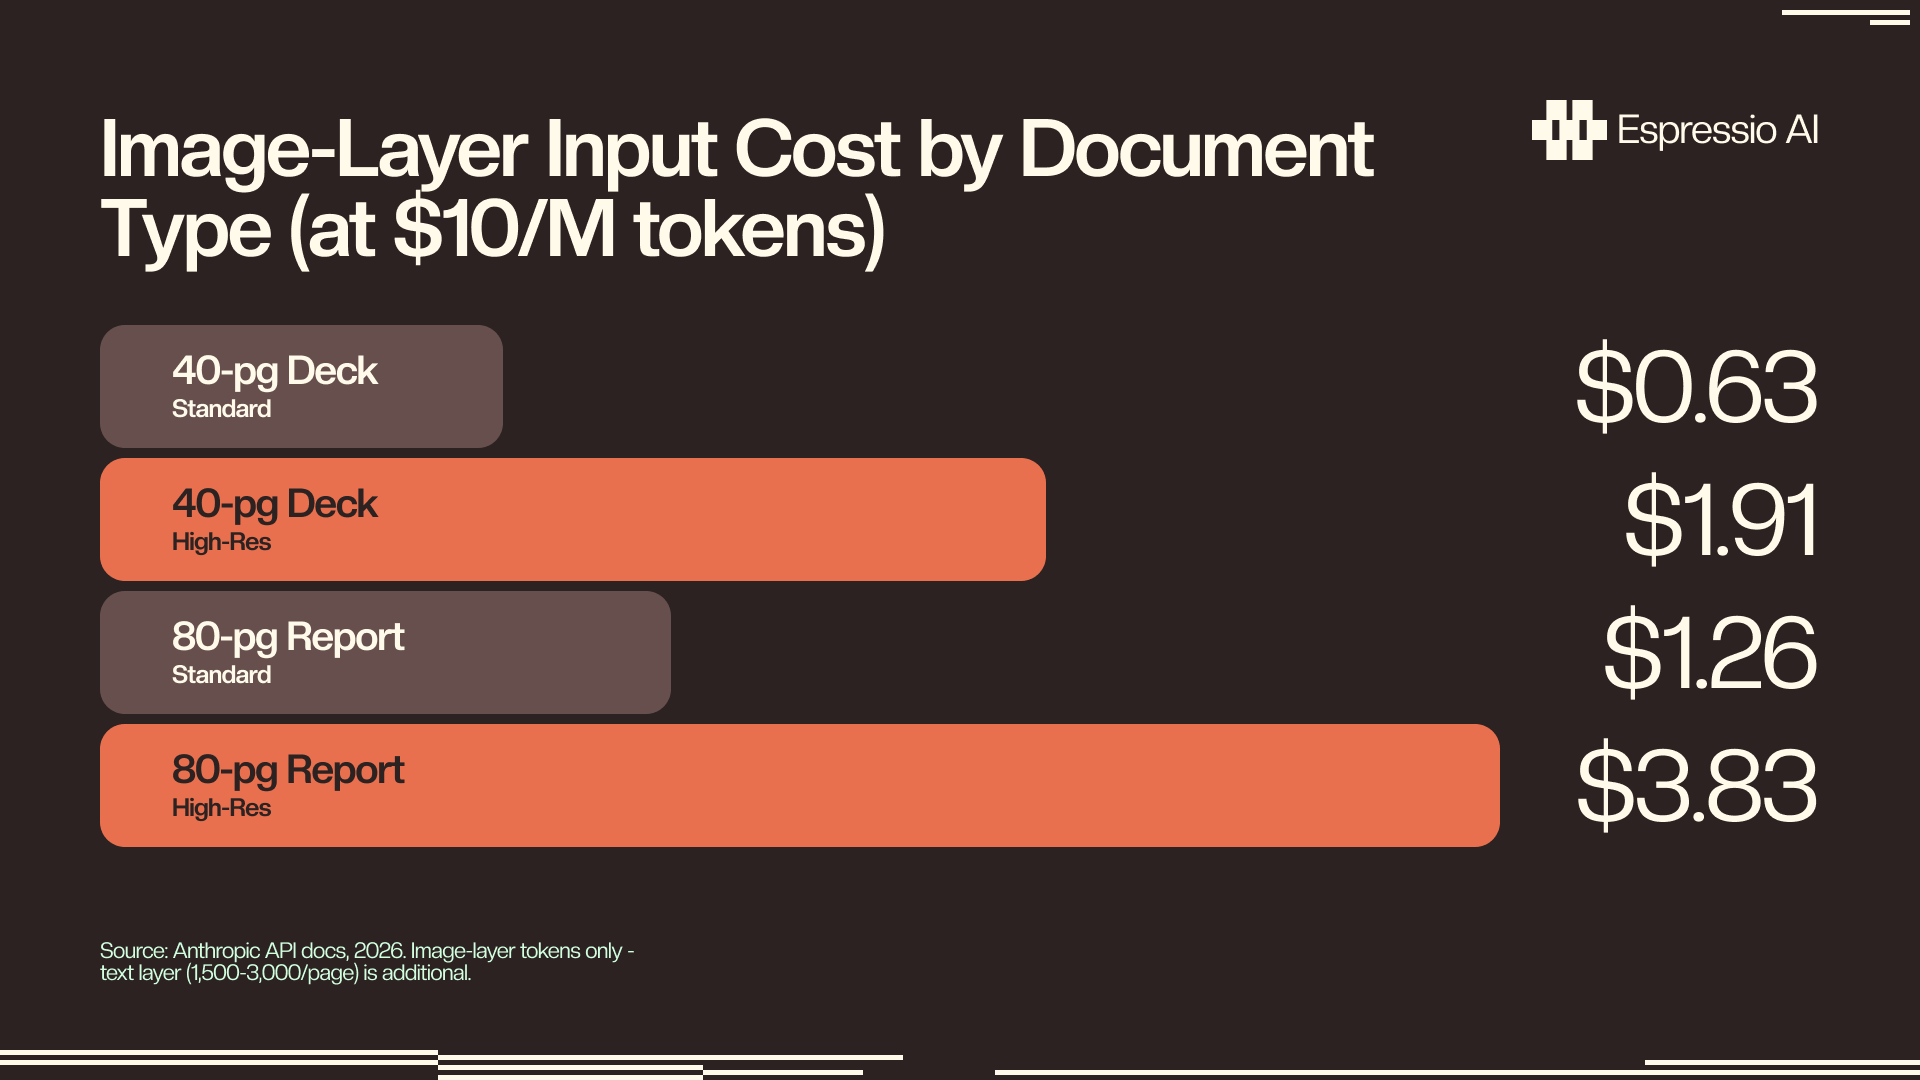
The image token cost is where most teams get surprised. Standard resolution renders each page image at approximately 1,568 tokens. High-resolution mode (the right choice for chart-heavy documents) renders at roughly 4,784 tokens per image. That’s a 3× cost multiplier that doesn’t appear in the base-model pricing page and isn’t flagged in the current documentation.
The math on a 40-page earnings deck makes the choice concrete: at $10/M input and high-res mode, image tokens alone run approximately $1.91, compared to $0.63 at standard resolution. Add the text layer (roughly $0.80 for 80K text tokens), and total document input cost is $1.43 at standard versus $2.71 at high-res. For a team running this on 200 documents per month, that’s $286 versus $542 in input tokens — before any output. What’s not documented anywhere: downsampling embedded chart images in PDFs to 72 DPI before upload cuts high-res token costs 40–60% with no measurable accuracy loss on standard bar and line charts. This is one of the more impactful cost levers available.
When does high-res mode pay off? On documents with small chart labels, dense axis annotations, or figures where fine detail drives the extraction: earnings decks, technical research reports, and regulatory filings with annotated tables. For text-heavy PDFs like meeting notes or legal briefs with minimal embedded charts, standard resolution is the right default.
How to extract chart data as structured JSON
Eighty to ninety percent of enterprise data is unstructured, but only 18% of organizations have automated extraction at scale (Market.us, 2026). For chart-specific extraction, Fable 5 closes that gap: it returns bar and line chart values as structured JSON when given an explicit schema, with no fine-tuning and no custom model.
Three prompt patterns cover most extraction tasks: data extraction (return chart values as JSON), trend analysis (describe the direction and magnitude of change in natural language), and structured comparison (extract table data row-by-row into a typed schema). For most teams, data extraction handles the bulk of the use cases. The minimal implementation:
import anthropic
import base64

client = anthropic.Anthropic()

with open("q2_earnings.pdf", "rb") as f:
    pdf_data = base64.standard_b64encode(f.read()).decode("utf-8")

message = client.messages.create(
    model="claude-fable-5-20260601",
    max_tokens=4096,
    messages=[
        {
            "role": "user",
            "content": [
                {
                    "type": "document",
                    "source": {
                        "type": "base64",
                        "media_type": "application/pdf",
                        "data": pdf_data,
                    },
                },
                {
                    "type": "text",
                    "text": (
                        "Extract every bar chart and line chart from this document. "
                        "Return a JSON array with this exact structure:\n\n"
                        '{"charts": [{"title": "string", "type": "bar|line|scatter", '
                        '"x_axis": "label", "y_axis": "label with unit", '
                        '"series": [{"name": "Series A", "points": [{"x": "Q1 2026", "y": 42.1}]}], '
                        '"page": 1}]}\n\n'
                        "Return JSON only. No commentary."
                    ),
                },
            ],
        }
    ],
)

print(message.content[0].text)
We run this pattern on quarterly earnings decks at Espressio, processing 20 charts per report across companies in our coverage universe. Fable 5 handles standard bar charts, multi-series line charts, and scatter plots without accuracy issues, including logarithmic Y axes where Opus 4.8 consistently hallucinated values in the 3–10× range. Two chart types still require manual review: heat maps with more than 6×6 cells and radial/spider charts. For those, Fable 5 reads the structure correctly but produces interpolated numerical estimates with 15–25% error rates. The fix is to extract the chart image separately and send a focused prompt asking for a trend description rather than exact values. The description is accurate; the precise enumeration isn’t, and knowing that boundary prevents downstream data quality issues.
For the full token cost model that governs every Fable 5 vision pipeline, including per-call cost optimization across agentic loops, see Claude Fable 5 token economics for production agents.
Step 1: Set up your document pipeline with the Files API
The Files API eliminates the single biggest cost inefficiency in document pipelines: uploading the same file on every query (Anthropic API docs, 2026). Upload once, store the file_id, and reference it for every subsequent call. For a document you query five times (once for chart extraction, once for table data, once for the executive summary, once for risk factors, and once for footnotes), you pay the upload cost once.
Prompt caching compounds this further. After the first request containing a cached document prefix, subsequent reads cost 0.1× the standard input rate, a 90% discount (Anthropic API docs, 2026). The cache write on the first query costs 1.25× standard; every read after that runs at 0.1×. Break-even arrives at query two. For recurring documents like monthly reporting packs or standing contract libraries, the economics shift materially in favor of the Files API over inline base64 uploads.
import anthropic

client = anthropic.Anthropic()

# Upload once — store file_id in your database or memory store
with open("q2_earnings.pdf", "rb") as f:
    uploaded = client.beta.files.upload(
        file=("q2_earnings.pdf", f, "application/pdf"),
    )

file_id = uploaded.id  # e.g. "file_abc123" — persist this

# All subsequent queries reference file_id — no re-upload cost
def query_document(file_id: str, prompt: str) -> str:
    message = client.beta.messages.create(
        model="claude-fable-5-20260601",
        max_tokens=4096,
        messages=[
            {
                "role": "user",
                "content": [
                    {
                        "type": "document",
                        "source": {"type": "file", "file_id": file_id},
                    },
                    {"type": "text", "text": prompt},
                ],
            }
        ],
        betas=["files-api-2025-04-14"],
    )
    return message.content[0].text

# Four queries against the same file — one upload cost, four 90%-discounted reads
charts   = query_document(file_id, "Extract all charts as JSON.")
tables   = query_document(file_id, "Extract all tables as JSON.")
summary  = query_document(file_id, "Summarize the MD&A section in 3 bullet points.")
risks    = query_document(file_id, "List the top 5 risk factors from the Risk Factors section.")
The Files API is in beta as of June 2026 and requires the files-api-2025-04-14 flag. File storage is free; you pay input tokens only when the file is referenced in a message. For teams setting up the Claude API across multiple workflows, the Files API is the right default for any document processed more than once.
Step 2: Build a batch extraction pipeline for high-volume document queues
The Message Batches API processes document queues at 50% off standard pricing with results available within 24 hours (Anthropic API docs, 2026). For nightly extraction runs where latency doesn’t matter (100 earnings reports, a new contract batch, a weekly competitive intelligence update), batch processing cuts per-document cost roughly in half. What does that look like at volume? At $10/M input tokens and 30,000 tokens per document on average, each document costs $0.30 at standard pricing and $0.15 through the Batch API. For 500 documents overnight, that’s $75 versus $150.
There’s a production gotcha specific to teams building on Amazon Bedrock. The Bedrock Converse API does not enable visual PDF analysis by default; it silently falls back to text-only extraction unless you explicitly set the citations flag in your API request. There’s no error message, no warning, and no structural difference in the response. Teams get a response that appears complete, but chart data simply isn’t in it. If you’re on Bedrock and chart extraction results are consistently empty or returning “no charts found,” this is almost always the cause. The fix is a single configuration change: enable citations in the Converse API call. The InvokeModel API does not have this limitation. This issue has zero public documentation; every team that hits it spends days debugging what looks like a model quality problem before finding the flag.
For agents that process recurring documents across sessions and need to store extraction results without repeating work on every run, the memory architecture for document-processing agents covers the four-layer store pattern that pairs with Files API file_id storage.
What does Fable 5 vision mean for finance, legal, and RevOps teams?
Intelligent document processing automation cuts processing time by more than 50%, and one financial services firm documented $2.9M in annual savings from IDP alone (Market.us, 2026). Error rates drop over 52% compared to manual processing, and year-one ROI ranges from 30% to 200% depending on document volume and current processing costs (Market.us, 2026). Returns are highest in organizations where analysts currently spend significant time re-entering chart data from PDFs into spreadsheets.
Finance teams get the clearest immediate value: earnings deck processing (extract chart series as JSON, compare quarter-over-quarter automatically), 10-K table extraction (revenue by segment, geographic breakdown, operating metrics), credit memo analysis, and competitive benchmarking from industry report PDFs all required manual re-entry until Fable 5. The model handles all four at production scale, with the caveat on heat maps and radial charts noted above.
Legal teams use Fable 5 for contract clause extraction (identify and return all indemnification clauses as structured JSON), defined terms indexing (every term defined in Section 1 with its page reference), and redline comparison across document versions. The 600-page limit matters here: multi-exhibit agreements and regulatory filings that previously had to be split across multiple API calls now process in a single request.
RevOps teams see the highest ROI on RFP response generation from specification PDFs, proposal gap analysis (compare a prospect’s requirements against your capability documentation), and structured CRM updates from meeting transcripts in PDF format. For broader revenue team automation workflows that extend to document processing, document analysis sits at the intersection of every deal-cycle data source.
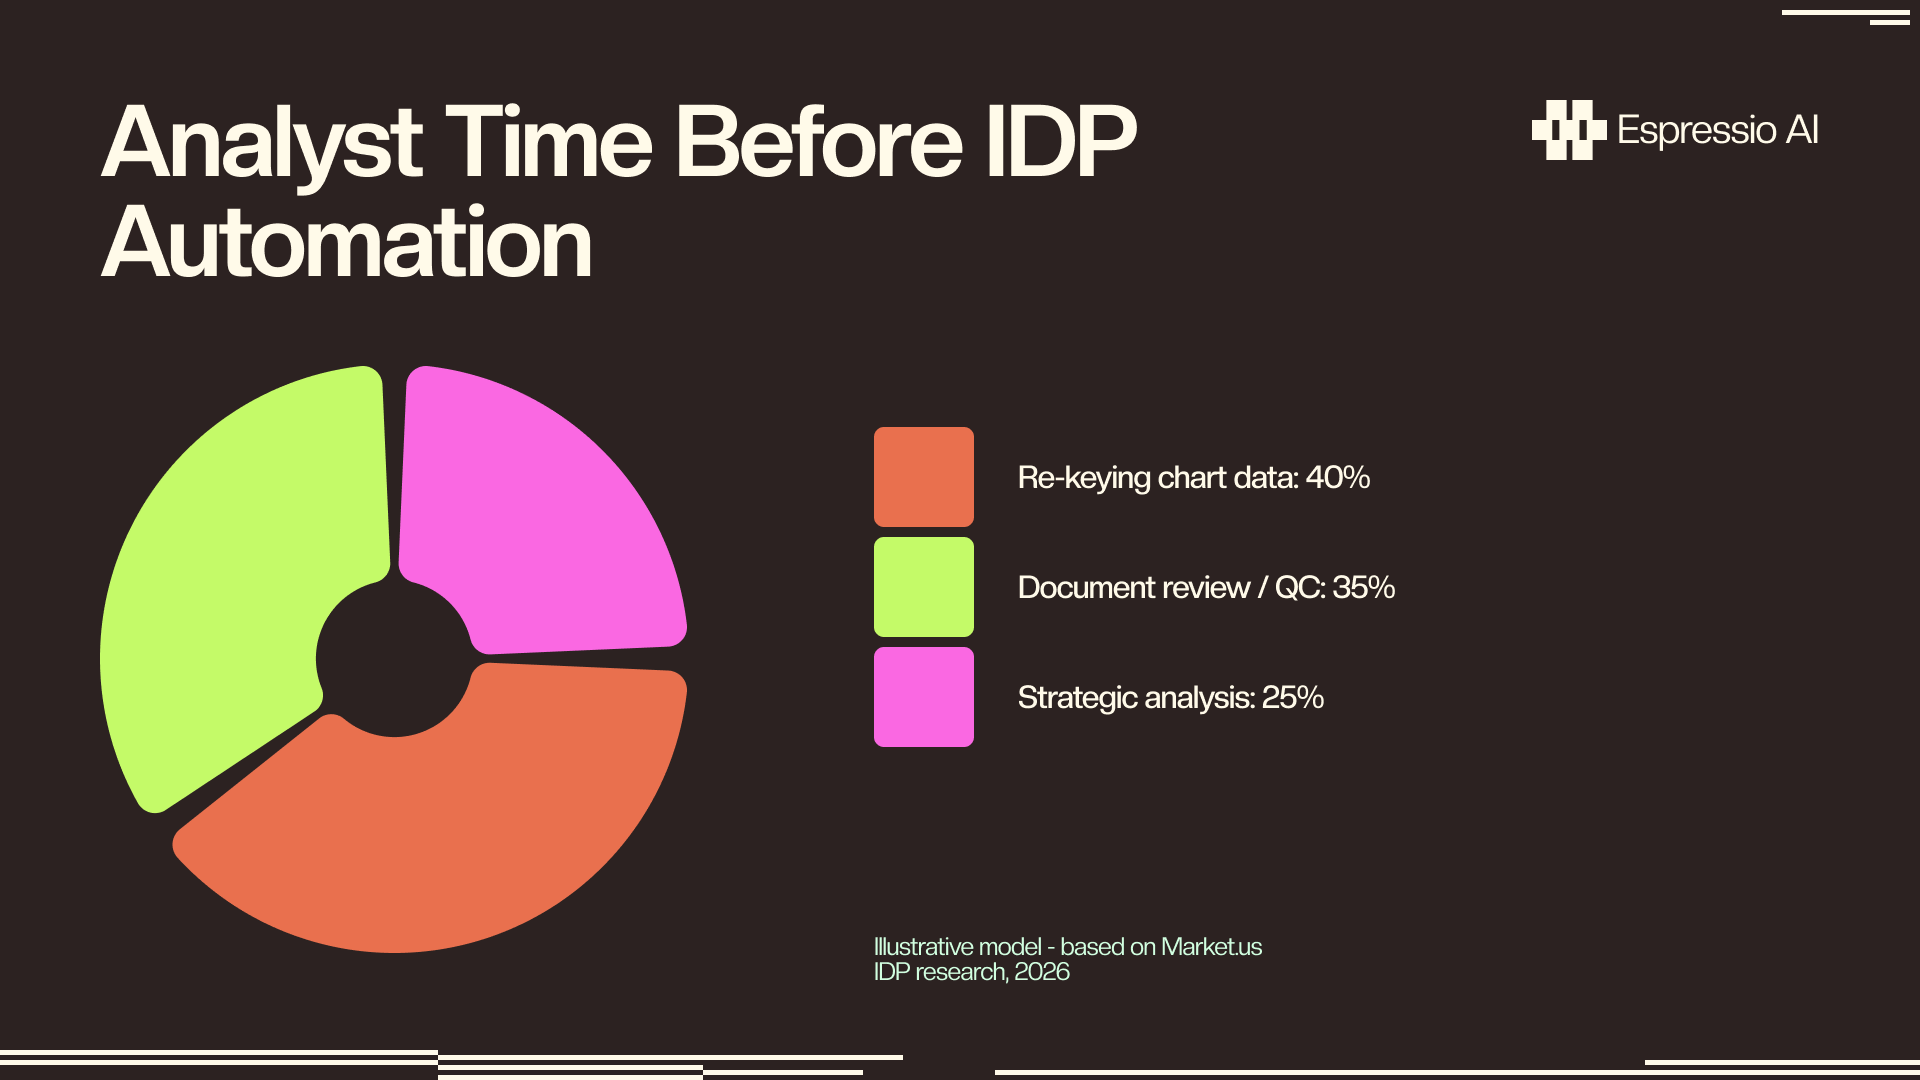
A finance team that spent 40% of document review time re-entering chart data now spends that time on the analysis the chart enables. Fable 5 vision frees the analyst from extraction so they can focus on what the charts actually mean for the business.
If you want to map this to your document stack, let’s chat. The Espressio team scopes Fable 5 vision workflows in a 45-minute session.
Frequently asked questions
How many pages can Claude Fable 5 process per PDF request?
Fable 5 supports up to 600 pages per request with a 32MB file size limit, six times the capacity of 200K-context models (Anthropic API docs, 2026). Each page consumes 1,500–3,000 tokens for text plus image tokens at 1,568 (standard) or 4,784 (high-res). For most financial filings and legal contracts, a single API call covers the full document without chunking.
Can Claude Fable 5 extract chart data as structured JSON?
Structured JSON output works reliably for bar charts, line charts, and scatter plots when you provide an explicit schema in the prompt. Fable 5 returns labeled data series, axis labels, and units without extra parsing logic. Heat maps and radial charts produce lower-confidence numerical outputs; for those, prompt for a trend description rather than exact values.
How does Fable 5 vision compare to GPT-4o for document analysis?
On the GDP.pdf visual document reasoning benchmark, Fable 5 scores 29.8% versus Opus 4.8 at 22.5% (vellum.ai, June 2026). Fable 5 also leads Hebbia’s senior-level finance benchmark, which is the most domain-specific public evaluation of document AI performance available. GPT-4o’s published GDP.pdf score sits below both Claude models on this benchmark as of June 2026.
What is the token cost for a 100-page PDF with Fable 5?
A 100-page PDF at standard resolution costs approximately $1.50 for text-layer tokens (100 pages × 1,500 tokens × $10/M) plus $1.57 for image-layer tokens (100 images × 1,568 tokens × $10/M), totaling roughly $3.07 in input tokens before output (Anthropic API docs, 2026). High-resolution mode adds $4.78 in image tokens, bringing the input total to approximately $6.28. The Files API plus prompt caching brings repeat-query read costs down to 0.1× of those figures.
Does Claude Fable 5 vision work on Amazon Bedrock?
Yes, through both the Converse API and the InvokeModel API (Anthropic API docs, 2026). The Converse API requires citations to be explicitly enabled for visual PDF analysis; without this flag, the API falls back to text-only extraction with no error or warning. If chart extraction is returning empty results on Bedrock, this configuration flag is almost always the cause. The InvokeModel API does not have this limitation and requires no extra configuration.
Next steps
Claude Fable 5’s vision layer is benchmark-leading for document work, but the production value depends on intentional architecture: resolution mode choices, Files API caching economics, and Batch API timing all determine whether a document pipeline compounds value or compounds cost. The benchmarks establish the capability ceiling; the configuration choices determine where teams actually land.
The full token cost model that governs every Fable 5 pipeline covers the optimization levers in detail, including the agentic loop cost structures that apply equally to document pipelines. For teams building agents that process recurring documents across sessions, the memory architecture for document-processing agents covers how to store and reuse extraction results without repeating work on every run. Teams that want to feed document outputs into broader research pipelines should also see how to automate research pipelines with Perplexity and Claude for the upstream data collection layer.
If you want us to build this for your team, let’s chat.